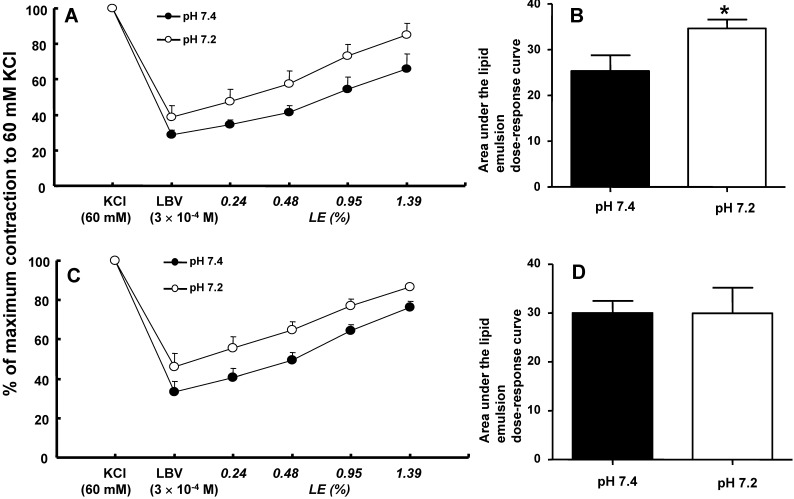
Figure 3.
A and C: The effects of mild pre-acidification (pH 7.2, N = 8) on the SMOFlipid® emulsion (LE) concentration-response curves during levobupivacaine (LBV, 3 × 10⁻⁴ M)-induced vasodilation at a toxic dose in isolated endothelium-intact (A) and endothelium-denuded (C) aortae precontracted with 60 mM KCl. Data are shown as the mean ± SD and are expressed as the percentage of contraction induced by 60 mM KCl. N indicates the number of rats from which descending thoracic aortae were obtained. B and D: The effect of mild pre-acidification (pH 7.2, N = 8) on the areas under the lipid emulsion dose-response curves from LBV (3 × 10⁻⁴ M)-induced vasodilation in isolated endothelium-intact (B) and endothelium-denuded (D) aortae precontracted with 60 mM KCl. The areas under the lipid emulsion dose-response curves were calculated from the baseline LBV (3 × 10⁻⁴ M)-induced vasodilation. Data are presented as medians and interquartile ranges. *P < 0.001 compared with pH 7.4.

