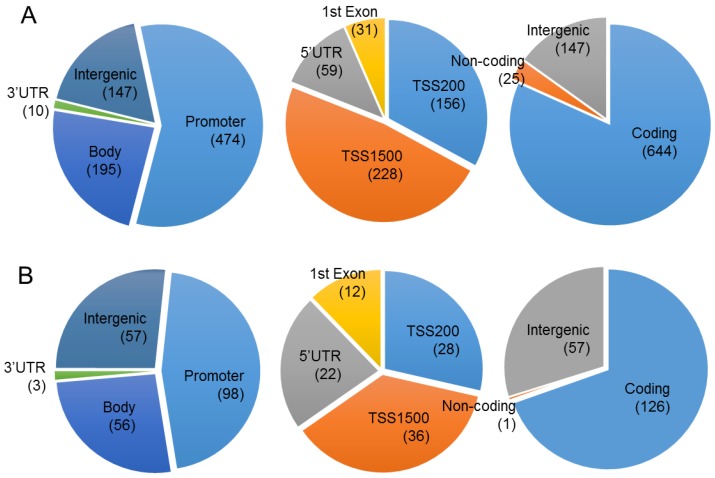
Figure 2.
Chromosomal distribution of the CpGs in which methylation level was significantly changed by proton beam treatment. Genome-wide methylation analysis of CpGs in the MCF-7 cell line was carried out on a 450K microarray, and CpGs showing significant changes by proton beam treatment compared with untreated cells were adopted for the analysis. Venn diagrams show the allocation of the CpGs on chromosome, which were hypermethylated (A) and hypomethylated (B). The values in parentheses indicate the number of CpGs in each category. TSS, transcription start site; UTR, untranslated region.

