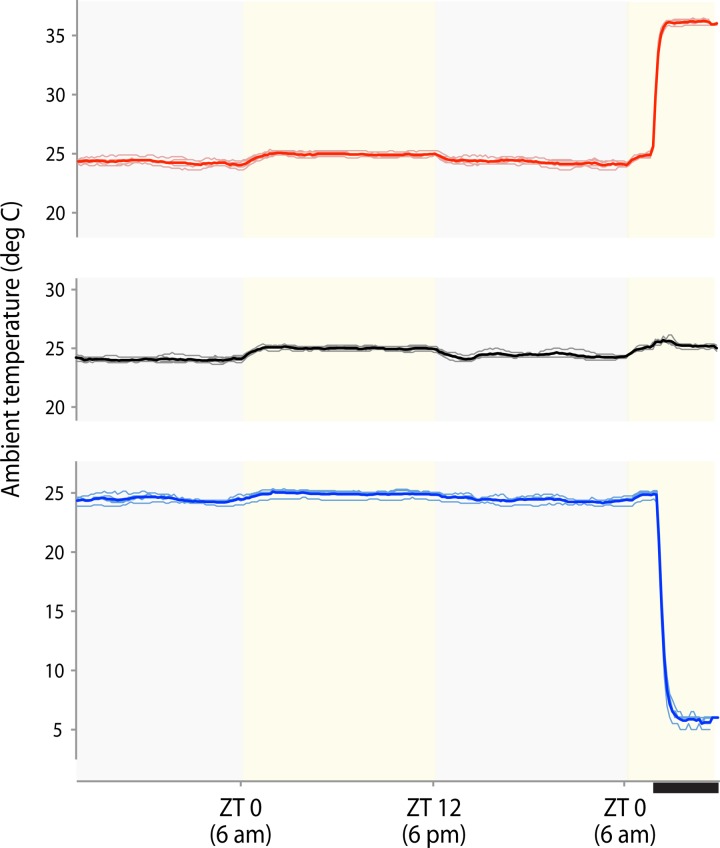
Fig. 1.
Ambient temperature trends inside individual cages from each group (n = 4 each). Thin lines denote temperatures from individual cages in each group: warm-exposed, control, and cool-exposed; thick lines represent group averages. At baseline, ambient cage temperatures remain stable near 24°C during the dark period and approach 25°C during the light period, possibly due to heat generation by fluorescent lamps along the chamber walls. Warm-exposed cage temperatures rapidly increase to 36°C for the last 4 h of the experiment. In the control group, ambient temperatures remain between 24 and 25°C. Cool-exposed cage temperatures fall quickly to 5–6°C for the final 4 h of the experiment. ZT is zeitgeber time (ZT 0 is the time when lights were turned on). The thick black bar beneath the x-axis indicates the 4-h period of ambient temperature change before perfusion.

