
Fig. 3.
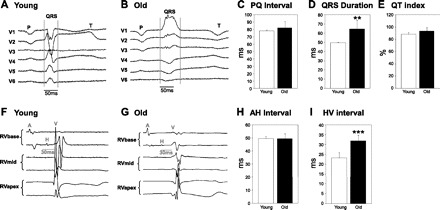
Electrocardiographic (ECG) parameters in young and old rabbits. A and B: representative ECG traces (chest leads V1–V6) of individual young and old rabbits, demonstrating classical right bundle branch block (RBBB) features along with the typically seen inverted T-wave in V1. P, P wave, QRS complex; T, T wave. C: PQ interval duration in 6 young and 8 old rabbits. D: QRS duration in 6 young and 8 old rabbits. **P < 0.01. E: heart rate-corrected QT index (QTi) in 6 young and 8 old rabbits. All values are shown as means ± SD. F and G: representative intracardiac ECG traces (RV apex, mid, and base position) of individual young and old rabbits. A, atrium; H, His electrogram; V, ventricle. H: duration of AH intervals, which reflect conduction from the atrium to the proximal His bundle, in 6 young and 8 old rabbits. I: duration of HV intervals, which reflects conduction from the His bundle via Purkinje fibers to the ventricle, in 6 young and 8 old rabbits. ***P < 0.0001. All values are shown as means ± SD.