
Fig. 5.
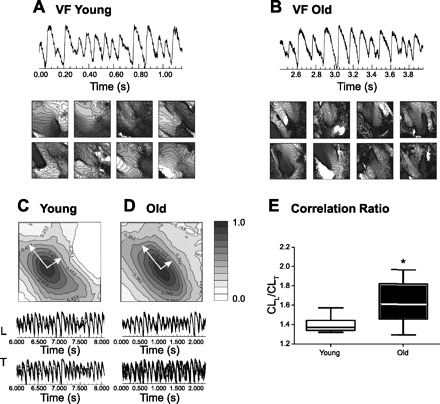
Ventricular fibrillation (VF) in young and old hearts. A and B: representative series of activation maps of hearts during VF from the LV in 3 young and 7 old hearts. Isochronal lines are drawn at 2-ms intervals, and brighter colors indicate earlier activation. C and D: cross-correlation of propagating waves in the longitudinal (L) and transverse (T) directions of individual young and old rabbit hearts during VF. E: box graphs of correlation length ratio (CLL/CLT) in 3 young and 7 old rabbit hearts. *P < 0.05; all values are shown as means ± SD.