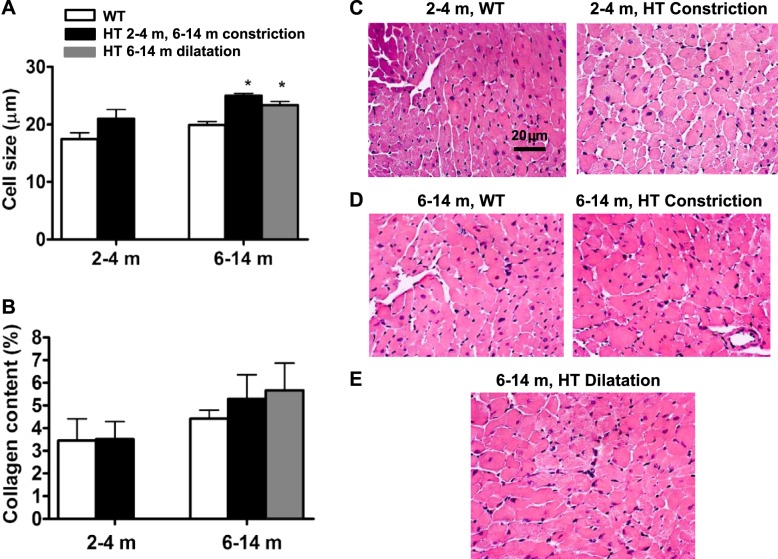
Fig. 4.
Cardiomyocyte hypertrophy in Marfan HT mice of different age groups. A: quantification of ventricular myocytes transverse-section size in WT and Marfan HT mice. Data represent the short diameter of cardiomyocyte drawn through a nucleus. B: quantification of interstitial fibrosis in WT and Marfan HT mice. Values are means ± SE; n = 5–10 per group. *P < 0.05, WT vs. Marfan HT mice. C–E: representative histological sections of the myocardium from WT and Marfan HT mice: 2–4 m (C) and 6–14 m WT and HT constriction (D) and 6–14 m HT dilation (E).

