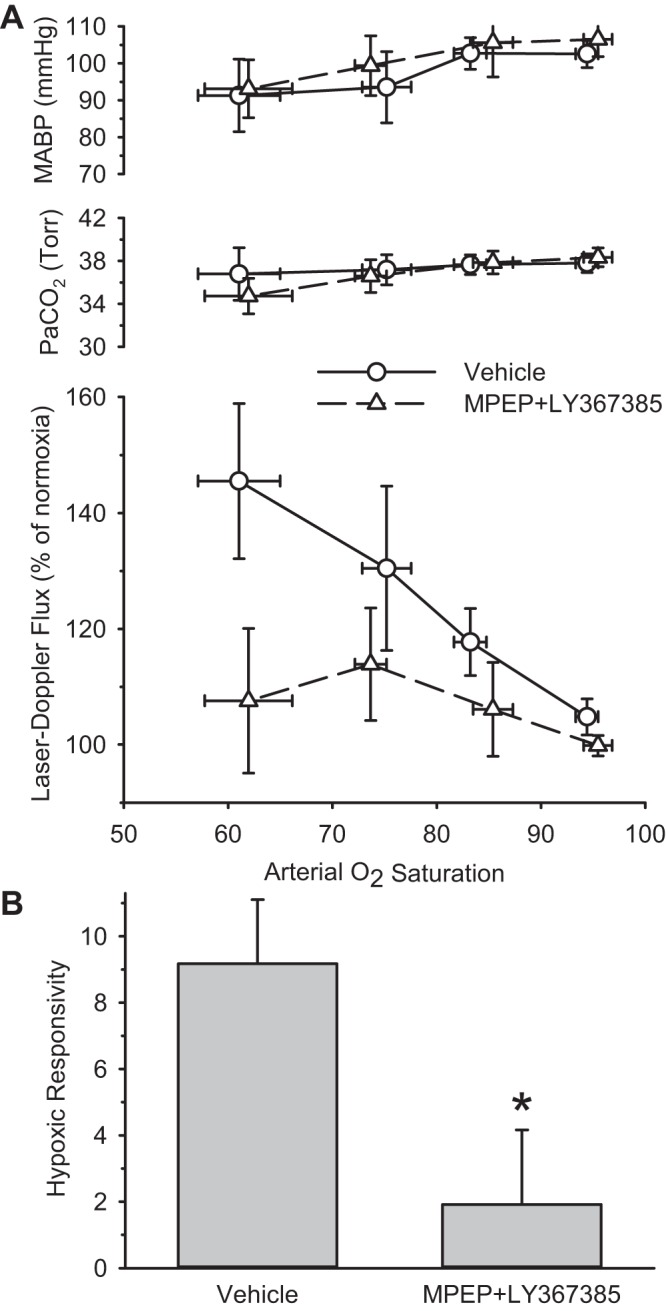
Fig. 3.

A: PaCO2, MABP, and cortical LDF are sorted by range of arterial O2 saturation and are plotted as means and 95% confidence intervals for groups treated with vehicle (n = 20) or the metabotropic glutamate receptor antagonists 2-methyl-6-(phenylethynyl)pyridine (MPEP) and (S)-(+)-α-amino-4-carboxy-2-methylbenzeneacetic acid (LY367385; n = 15). B: hypoxic responsivity is plotted for groups treated with vehicle and MPEP plus LY-367385. *P < 0.05 from vehicle group.
