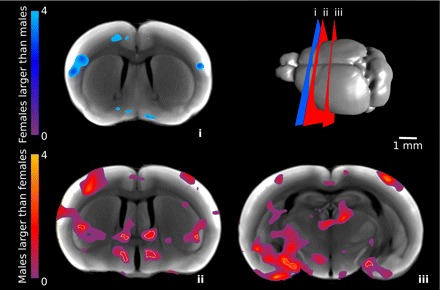
Fig. 6.

Volume differences in male and female brains. Per-voxel volume differences of neuroanatomical structures in male and female mice are shown by effect size differences of Jacobian statistical maps between male and female mice. Cold colors indicate regions where males are smaller than females, and hot colors indicate where males are larger than females. Outlined in white are voxels that are significant to a 10% false discovery rate. Slice locations (i–iii) are shown schematically at the top right.
