Fig. 4.

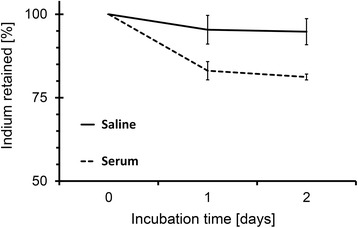
Retention of 111In in micelles as function of time. Polymer concentration 4.3 mg/mL, tropolone concentration 0.8 μM, and 111In activity 50 kBq per sample. The uncertainty bars are the standard deviations (N = 3)

Retention of 111In in micelles as function of time. Polymer concentration 4.3 mg/mL, tropolone concentration 0.8 μM, and 111In activity 50 kBq per sample. The uncertainty bars are the standard deviations (N = 3)