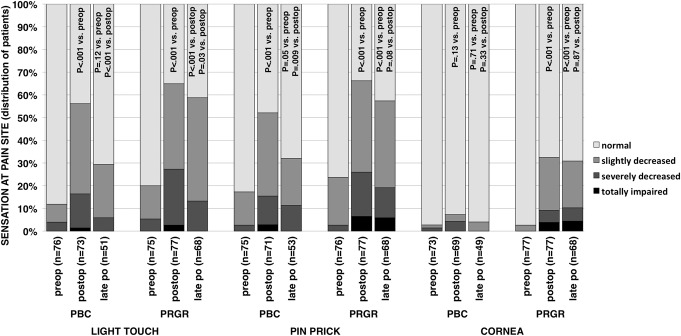
FIGURE 4.
Distribution within groups of patients undergoing percutaneous balloon compression (PBC) and percutaneous retrogasserian glycerol rhizotomy (PRGR) of sensation at the pain site according to a 4-grade scale ranging from normal to totally impaired. Distribution difference between 3 time points for each modality and treatment are examined with Wilcoxon signed-ranks tests. P values in the postoperative bars relates to a comparison with the related preoperative distribution. P values to the left in the late postoperative bar relate to a comparison with the related preoperative distribution, whereas P values to the right in the late postoperative bar relate to a comparison with the related postoperative distribution.

