FIGURE 5.

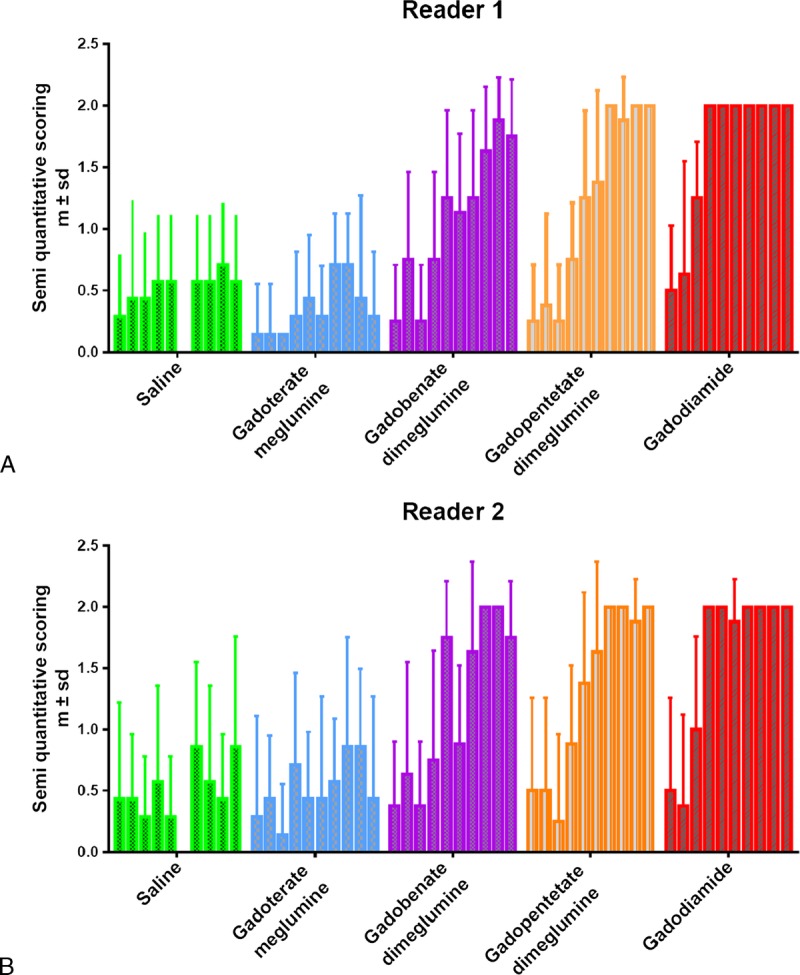
Temporal changes in qualitative blinded evaluation of the T1-weighted signal hyperintensity between the DCN area and cerebellar cortex (mean ± SD). Each box plot represents 1 week of follow-up (10 box plots per product).

Temporal changes in qualitative blinded evaluation of the T1-weighted signal hyperintensity between the DCN area and cerebellar cortex (mean ± SD). Each box plot represents 1 week of follow-up (10 box plots per product).