
FIGURE 8.
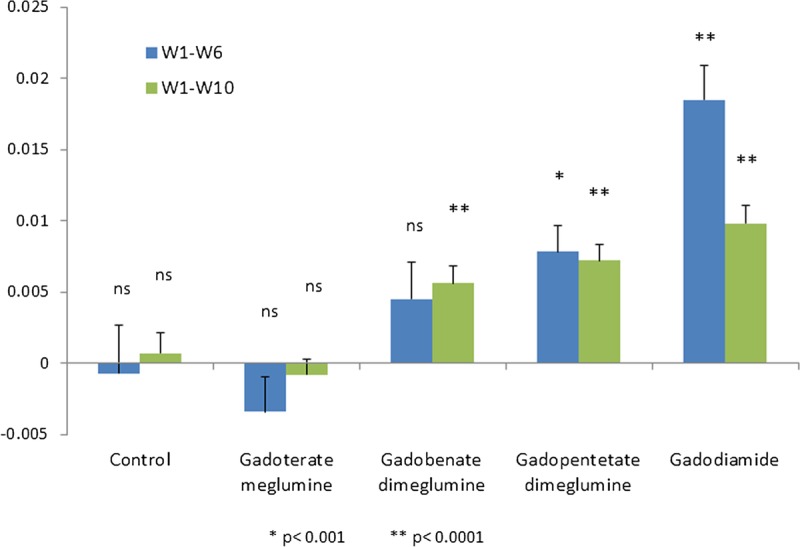
Slope of the temporal changes in DCN/cerebellar cortex T1-weighted signal ratio (mean ± SD).
Official websites use .gov
A
.gov website belongs to an official
government organization in the United States.
Secure .gov websites use HTTPS
A lock (
) or https:// means you've safely
connected to the .gov website. Share sensitive
information only on official, secure websites.
Slope of the temporal changes in DCN/cerebellar cortex T1-weighted signal ratio (mean ± SD).