Fig. 4.

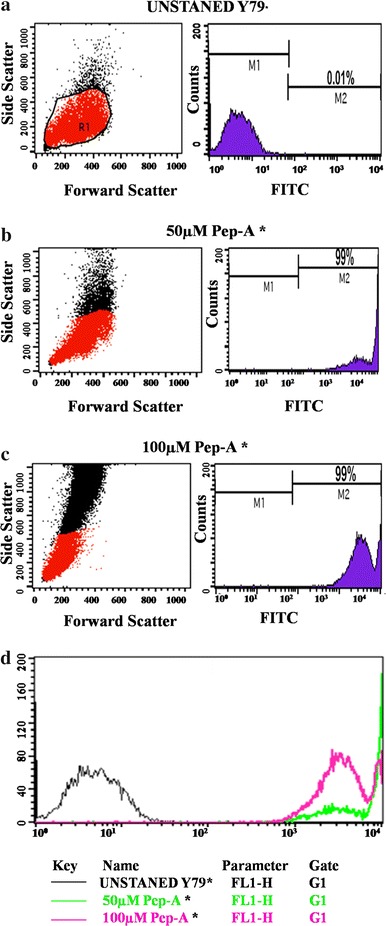
Cell uptakes of antioxidant peptide A in Y79 RB cells evaluated by flow cytometry. a Untreated Y79 RB cells, b and c cells treated with 50 and 100 µM of Pep-A showing maximum (99 %) number of FITC positive population in M2. d Overlay picture showing peptide uptakes in control and treated Y79 RB cells
