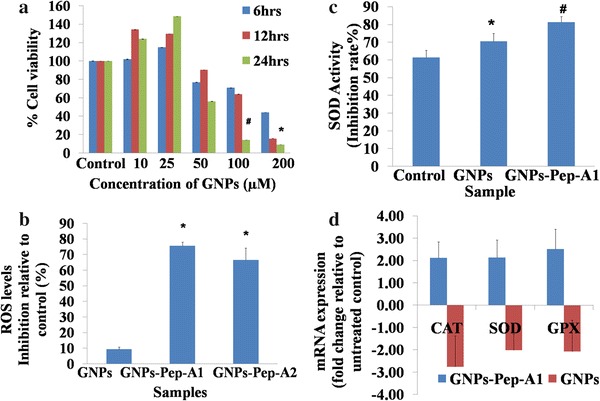
Fig. 6.

Functional studies with GNPs and GNPs-Pep-A bio conjugate. a Native GNPs treated on Y79 RB cells at varying dosages for 6, 12, and 24 h showed both dose- and time-dependent decreases in cell viability. # indicates statistical significant difference with respect to the controls for 50 µM at 24 h, whereas # indicates significant differences at 6, 12, and 24 h for 100 µM with respect to control at P < 0.05. b GNPs-Pep-A decreased the ROS levels in Y79 RB cells effectively compared to GNPs alone and peptide alone (Fig. 2a). The final concentration of 50 µM GNPs (Moles of gold) used for functional study. GNPs-PepA1 and GNPs-PepA2 contain the final concentrations of Pep-A being 100 and 250 µM, respectively. Each column indicates mean percentage inhibition of ROS levels from triplicate values relative to untreated control. Error bars SEM from triplicate values. * indicates the significant difference relative to GNPs at P < 0.05. c GNPs-Pep-A increased the SOD enzyme activity by 1.3-fold compared to 1.1-fold increase by GNPs alone. Each column indicates SOD activity (inhibition rate %) from triplicate values. Error bars indicate SEM from triplicate values. * Represents the statistical significant difference with respect to control at P < 0.05; # represent the significant difference relative to GNPs at P < 0.005. d Y79 RB cells treated with GNPs and GNPs-Pep-A were analyzed for mRNA expression of first-line defense antioxidant enzymes. GNPs and GNPs-Pep-A downregulated and upregulated the SOD (superoxide dismutase), GPX (glutathione peroxidase), and CAT (catalase) enzymes’ gene expression levels, respectively. Each column indicates mean ± SEM. of duplicate values
