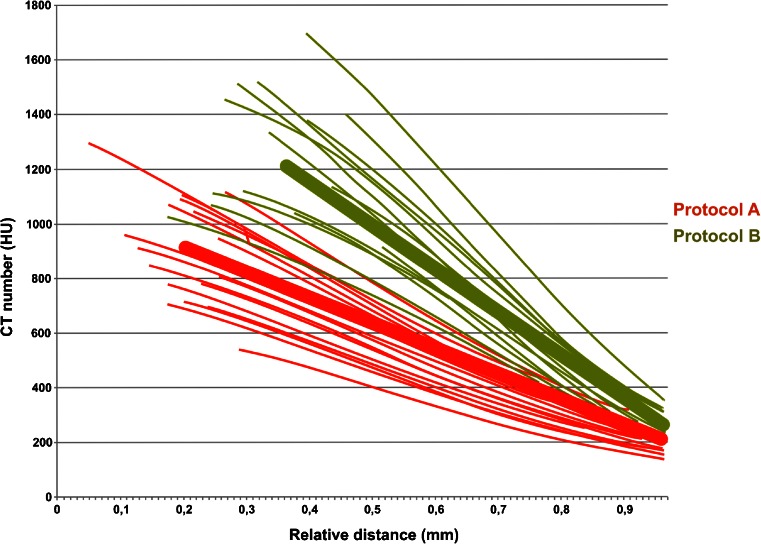
Fig. 4.
Mean slope of the edge profile between bone and brain parenchyma. The mean slope, defined as Δy/Δx, of protocol B is higher than in protocol A, meaning a sharper edge. Note the higher CT number (HU) of bony structures in protocol B and a higher contrast (relative signal) between bone and brain.

