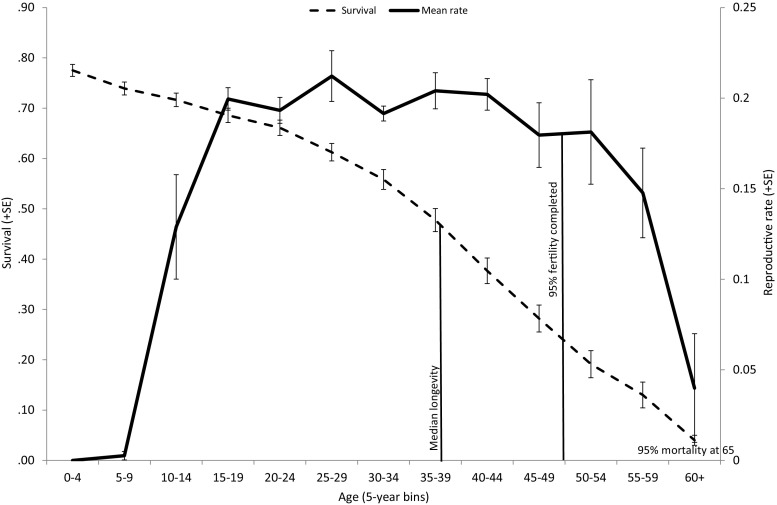
Fig. 1.
Population age-specific proportion surviving (±SE) in 5-year age bins for 1445 females from birth, plotted against mean (± SE) reproductive rates calculated from birth events for 834 females that survived to age 9 averaged over 5-year age bins (N females contributing: 639, 703, 637, 489, 379, 300, 231, 169, 115, 63, 33, 26, 12)

