FIGURE 3.

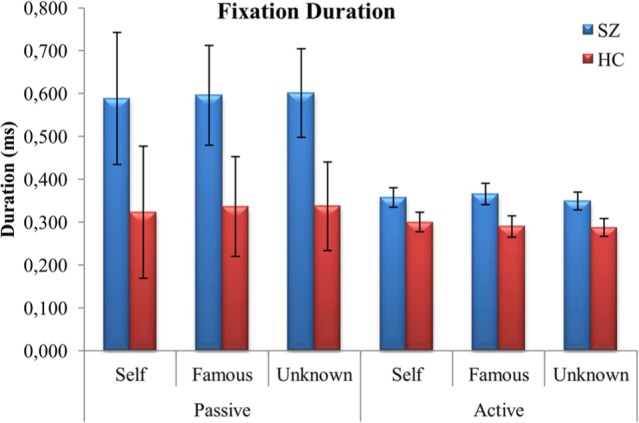
Mean (±SD) values representing duration of fixations (ms) for both schizophrenia patients (SZ) and healthy controls (HC): face vs. task.

Mean (±SD) values representing duration of fixations (ms) for both schizophrenia patients (SZ) and healthy controls (HC): face vs. task.