
Figure 14.
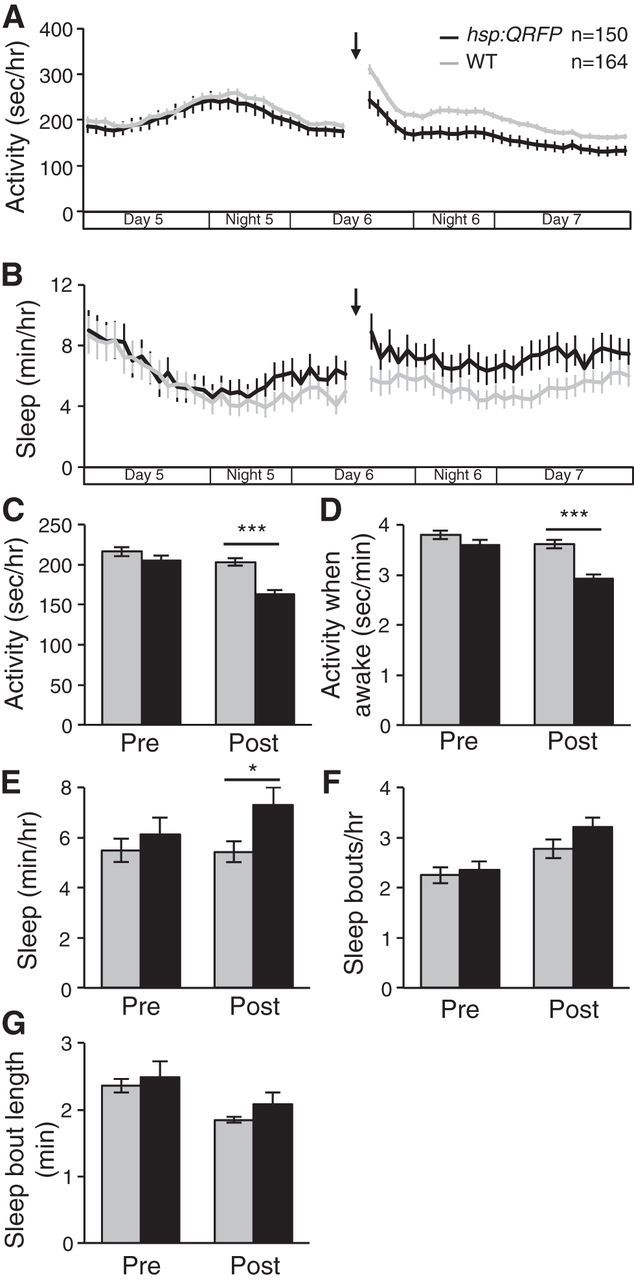
QRFP overexpression decreases locomotor activity and increases sleep in larvae raised and tested in constant light. A–E, When raised and tested in constant light, Tg(hsp:QRFP) larvae (black) exhibit less locomotor activity (A, C), less activity when awake (D), and more sleep (B, E) than their WT siblings (gray) following a heat shock given during Day 6 of development (indicated by arrows and gaps in line graphs). F, G, Analysis of sleep architecture reveals small but not statistically significant increases in both the number (F) and length (G) of sleep bouts. The x-axes in A and B indicate time periods that correspond to day and night in standard light/dark conditions. Line and bar graphs represent the mean ± SEM. Bar graphs quantify values for 30 h pre-heat shock and post-heat shock. n indicates the number of larvae analyzed. *p < 0.05, ***p < 0.001 for pairwise comparisons of Tg(hsp:QRFP) and WT larvae using Student's t test.