Figure 10.

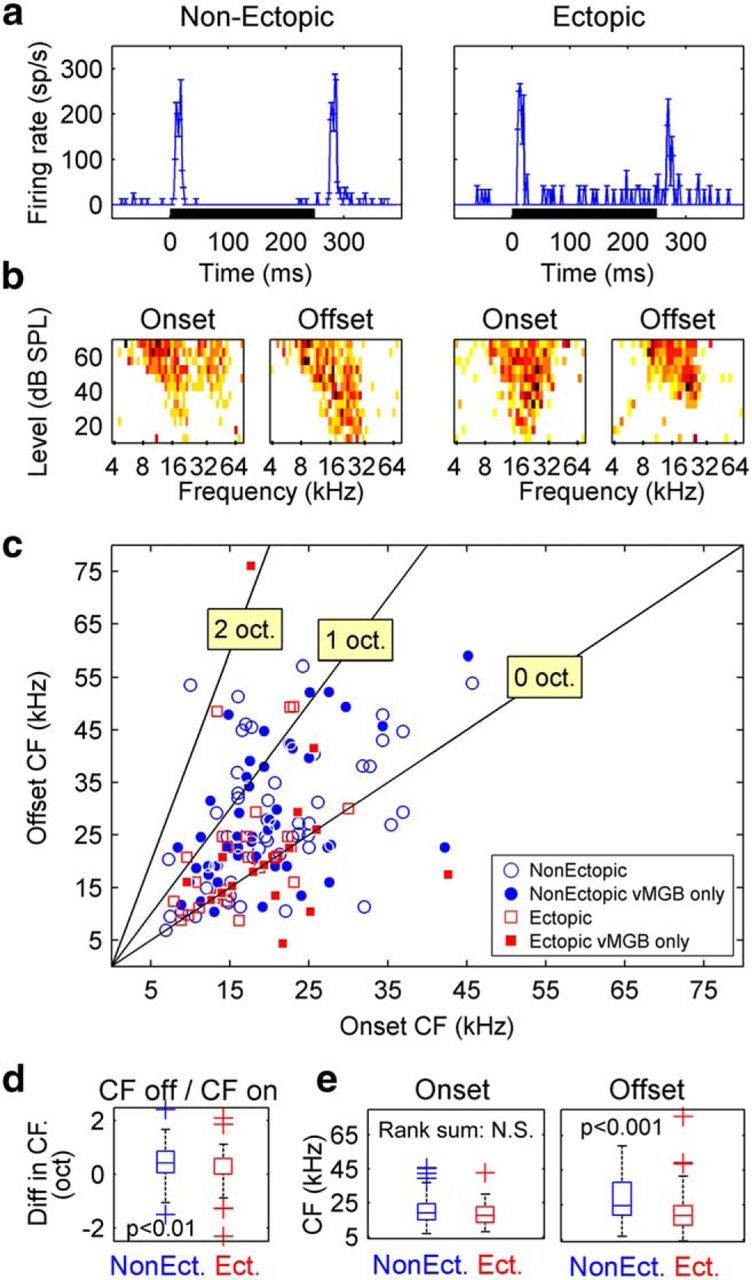
Abnormal tone-offset response characteristics in ectopic mice. a, b, Example data from two ventral MGB neurons (left, nonectopic mouse; right, ectopic mouse): PSTHs in response to noise stimuli (a) and frequency-intensity response areas showing tuning for onset and offset portions of responses to tones (b). PSTH conventions as in Figure 8. Color scale is the same for all frequency-intensity response areas. Darker colors represent higher firing rates. c, Scatterplot of tone-offset CF versus tone-onset CF, for all MGB neurons with clear transient responses both to tone onsets and to tone offsets. Filled symbols represent ventral MGB neurons. d, Boxplot showing octave difference between tone-offset and tone-onset CFs (i.e., ) for nonectopic and ectopic animals. p value indicates probability that medians for nonectopic and ectopic distributions are the same (Wilcoxon rank-sum test). e, Boxplots comparing absolute CFs of tone-onset (left) and tone-offset (right) responses between nonectopic and ectopic mice. Conventions as in d.
