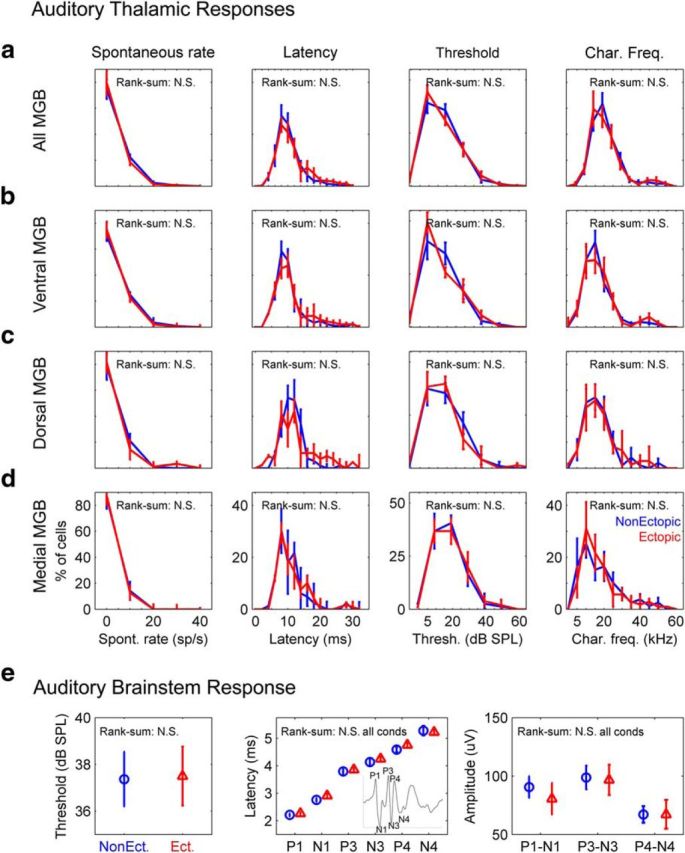
Figure 2.

No differences between ectopic and nonectopic mice in basic auditory thalamic response properties or in ABRs to clicks. All figure panels compare data from ectopic (red) and nonectopic (blue) animals and show results of Wilcoxon rank-sum tests for differences in medians; Kolmogorov–Smirnov tests for differences in distributions produced similar results. N.S., Not significant (see text). a, Pooled thalamic response data from neurons in all MGB subdivisions. Left to right, Spontaneous firing rates; peak latencies for responses to isolated clicks (click presentations separated by at least 800 ms); tone response thresholds; characteristic frequencies. Line histograms with error bars indicate mean ± SE across animals. b–d, Same as a but with neurons separated by MGB subdivision: ventral MGB (b), dorsal MGB (c), and medial MGB (d). e, Click ABR measures. Left to right, ABR thresholds; wave peak latencies for ABRs to 80 dB SPL clicks (inset, example ABR waveform with P1-N4 labeled); wave peak-to-trough amplitudes for ABRs to 80 dB SPL clicks. Symbols and error bars indicate mean ± SE across animals.
