Figure 8.

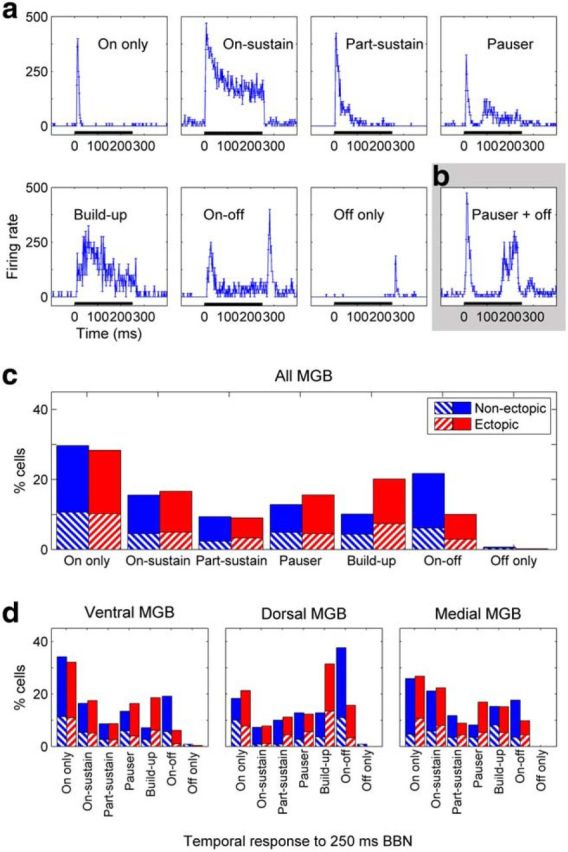
Differences between ectopic and nonectopic mice in distributions of temporal profiles for noise responses. a, Examples of different temporal profiles of responses to 250 ms broadband noise, all taken from ventral MGB recordings in one nonectopic animal. Plots represent mean ± SE in firing rate across trials for successive 1 ms bins. Black bar along axis represents noise stimulus. b, Example of a response that did not fit neatly into the common temporal profile categories; this response was classified as “Pauser” type but clearly also had a weak response to noise offset. c, d, Percentages of neurons with different noise response profiles in (c) MGB overall, or (d) ventral, dorsal, and medial MGB subdivisions individually. Relative proportions of neurons with the various noise-response profiles differed significantly between nonectopic and ectopic animals in MGB overall and in the ventral and dorsal MGB subdivisions individually, but not in the medial MGB subdivision (χ2 test, with rare “Off-only” responses merged with “On-off” responses as required for χ2 analysis: all MGB and ventral MGB, both p < 1 × 10⁻⁶; dorsal MGB, p < 0.005; medial MGB, p > 0.3). The differences in the distributions arose primarily from a decrease in the proportion of “On-off” response types, and an increase in the proportion of “Build-up” response types, in ectopic compared with nonectopic animals (see Results). Red represents ectopic animals. Blue represents nonectopic animals. Striped boxes represent single-unit recordings. Solid boxes represent multiunit recordings.
