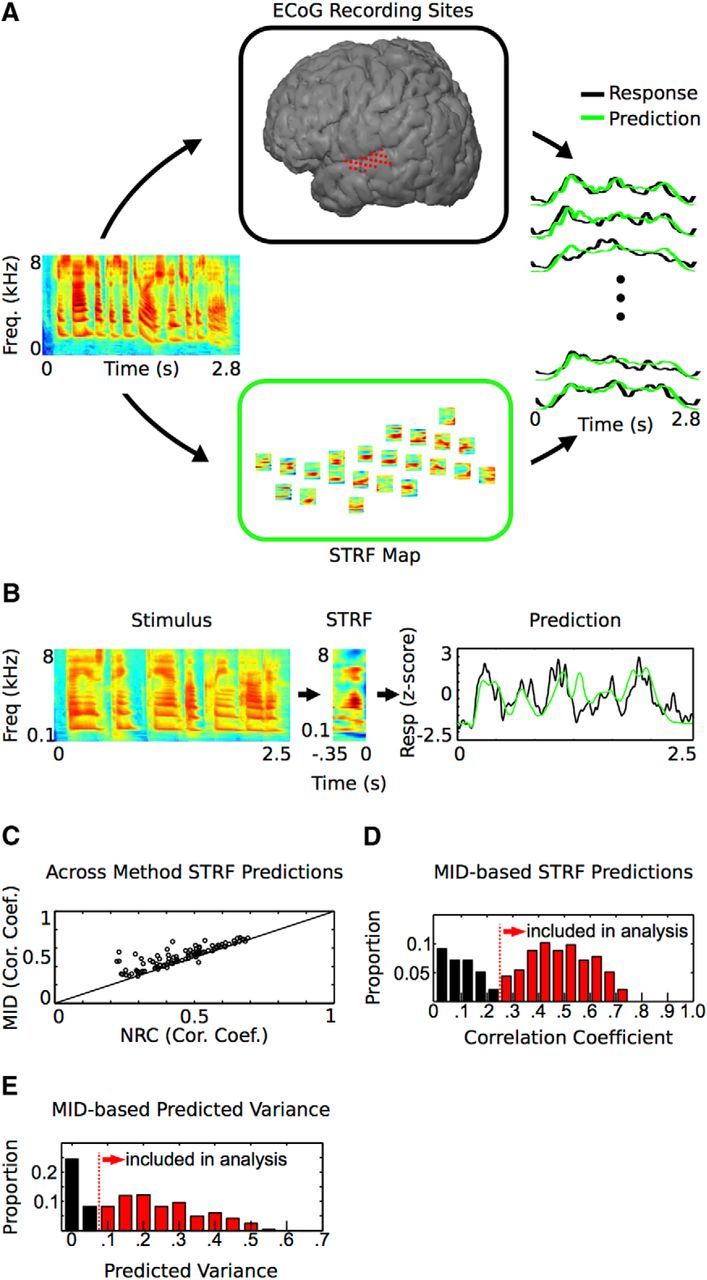
Figure 1.

Experimental approach and the STRF. A, Experimental approach. An STRF was computed off-line for each ECoG electrode site (top, center) to generate a corresponding STRF map (bottom, center). The STRF describes the spectrotemporal structure in the stimulus that drives activity at a particular site. On the right is a subset of measured and predicted responses for the sentence “He sized up the situation and shook his head” (spectrogram at left). B, An STRF and the predicted and measured response for a single sentence. Predicted responses are obtained by convolving the stimulus with the STRF and are proportional to the similarity between the spectrotemporal content in the stimulus and the receptive field. C, Comparison of two methods used to compute STRFs. MID-based STRFs show higher predictive performance compared with normalized reverse correlation (NRC)-based STRFs (mean percentage increase in prediction: 19.0 ± 1.9% SEM, p < 0.001, Wilcoxon signed-rank test). D, MID-STRF Pearson correlation coefficient prediction values for all STG sites. E, MID-STRF predicted variance values for all sites. Sites with >5% of the variance predicted (red) were included in the analysis. MID, maximally informative dimension analysis; NRC, normalized reverse correlation analysis.
