Figure 5.
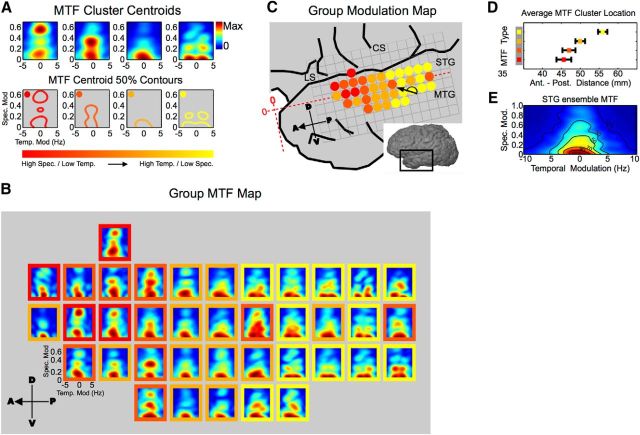
Organization of MTFs in STG. A, K-means cluster centroids generated from all MTFs across all participants. Their respective 50% contours are shown below. The overall tuning within an individual MTF centroid is fairly well localized. The collection of MTF centroid types span modulation space from high spectral/low temporal regions (red, left) to high temporal/low spectral regions (yellow, right) as shown by the 50% contours. B, Group MTF map. The map represents the average MTF across participants at each STG position. Only locations with ≥2 MTFs contributing to the average are included. Each MTF within the map is color-coded by its cluster membership. C, MTF cluster identity map. MTF cluster identities from B are plotted. The cluster identity map shows a transition from high spectral/low temporal MTFs anteriorly (red) to high temporal/low spectral MTFs posteriorly (yellow) and a significant degree of local organization (p < 1.0 × 10⁻⁵, neighborhood similarity permutation test). D, Average MTF cluster distance along the anterior–posterior extent of STG. Distances are measured from the anterior temporal pole illustrated in C (red horizontal axis). High spectral/low temporal MTFs are located anteriorly (red). High temporal/low spectral MTFs are located posteriorly (yellow, error bars represent SEM). E, Ensemble MTF (population average) for STG. Contour lines represent percentage maximum. LS, lateral sulcus; STG, superior temporal gyrus; MTG, medial temporal gyrus; CS, central sulcus.

