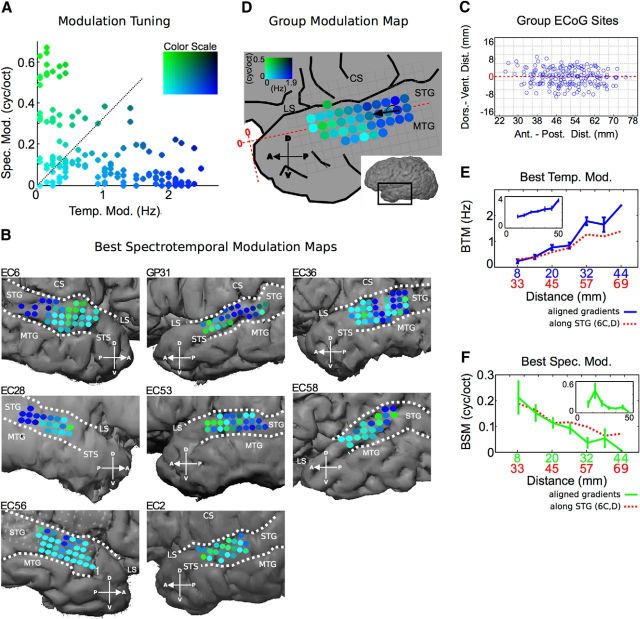
Figure 6.
Organization of bSTM tuning in STG. A, bSTM tuning values from all participants. The distribution of bSTM values shows a particular relationship in which spectral modulation tuning decreases as temporal modulation tuning increases. B, Individual subject bSTM maps (A, color scale). Most participants show high temporal/low spectral modulation tuning posteriorly (blue), and high spectral/low temporal modulation tuning anteriorly (green) with significant nonrandom organization (EC6, p < 1.0 × 10⁻⁵; GP31, p = 5.0 × 10⁻⁴; EC36, p = 0.029; EC28, p = 4.5 × 10⁻⁵; EC53, p = 0.015; EC58, p = 0.10; EC56, p = 0.06; EC2, p = 0.42; two-parameter neighborhood similarity permutation test). C, Topographic ECoG site distribution along the anterior–posterior/dorsal–ventral extent of the STG. An example of the coordinate system used to measure distances is shown in D (red axis). Distances along the long axis of STG are measured from the anterior temporal pole. Distances along the short axis of STG are measured from the dorsal–ventral midpoint of the STG. D, Group spectrotemporal modulation tuning map. Only sites with data from ≥2 participants are included. High temporal/low spectral modulation tuned sites are located posteriorly (blue) and high spectral/low temporal modulation tuned sites are located anteriorly (green) with significant nonrandom organization and a mean gradient of +176° counterclockwise from the long axis of the STG (p < 1.0 × 10⁻⁵, neighborhood similarity permutation test). Data were binned at 4 × 4 mm resolution (same interelectrode distance as the ECoG array). E, Average best temporal modulation tuning as a function of distance along the dominant spectrotemporal modulation gradient. Individual subject maps were aligned by their gradients before averaging (blue, error bars represent SEM). Absolute distance is from the edge of data after maps have been aligned. The red function represents the raw average of temporal modulation tuning as a function of distance along the STG from the anterior temporal pole (D, horizontal red line; no map alignment by gradient before averaging). The inset represents data from normalized reverse correlation-based STRFs. F, Average best spectral modulation tuning as a function of distance along the dominant spectrotemporal modulation gradient. Maps were aligned by their gradients before averaging (green, error bars represent SEM). Absolute distance is from the edge of data after maps have been aligned. The red function represents the raw average of spectral modulation as a function of distance along the STG from the anterior temporal pole (D, horizontal red line; no map alignment by gradient before averaging). The inset represents data from normalized reverse correlation-based STRFs. LS, Lateral sulcus; STS, superior temporal sulcus; MTG, medial temporal gyrus; CS, central sulcus.

