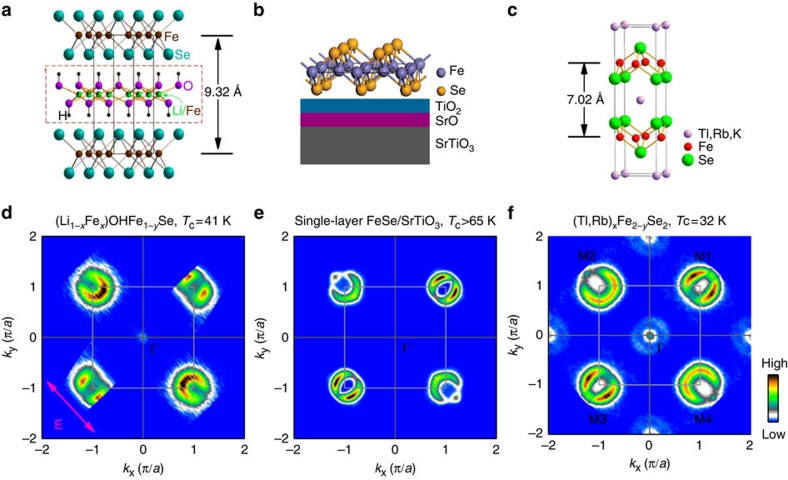
Figure 1. Crystal structure and Fermi surface of three FeSe-based superconductors.
(a) The crystal structure of (Li1−xFex)OHFe1−ySe. The c lattice constant is 9.318 Å for optimally doped sample with a Tc at 42 K (refs 36, 39). (b) Schematic structure of single-layer FeSe film deposited on a SrTiO3 substrate19. The thickness of the FeSe layer is ∼5.5 Å. (c) Schematic structure of (Tl,Rb)xFe2−ySe2 (ref. 12). The distance of the adjacent FeSe layers is ∼7.02 Å. (d) Fermi surface mapping of (Li0.84Fe0.16)OHFe0.98Se superconductor measured at 20 K. The spectral weight distribution was obtained by integrating the measured photoemission spectra (EDCs) within [−10,+10] meV energy window with respect to the Fermi level as a function of kx and ky. (e,f) Fermi surface of a superconducting single-layer FeSe/SrTiO3 film20 and (Tl,Rb)xFe2−ySe2 (ref. 17). For convenience, the four equivalent M points are labelled as M1(π,π), M2(−π,π), M3(−π,−π) and M4(π,−π). The light-grey arrow in d marks the main electric field direction on the sample surface from the light source. In d–f, the data around M1 and M4 are obtained from the data around M3 and M2, respectively, by applying the inversion symmetry.

