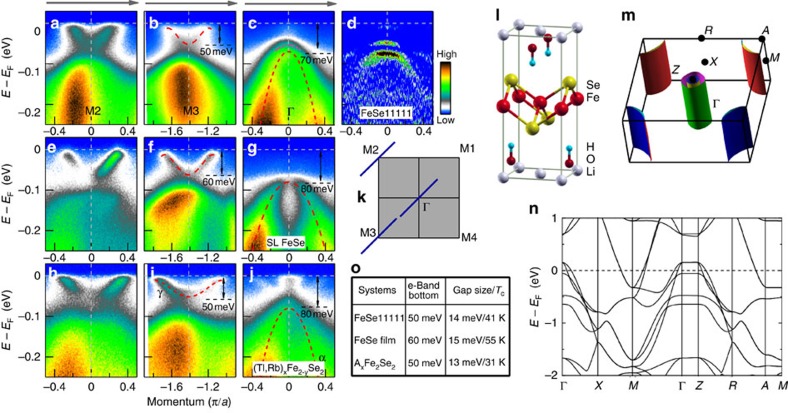
Figure 2. Band structure and photoemission spectra of (Li0.84Fe0.16)OHFe0.98Se superconductor measured along high-symmetry momentum cuts.
(a-c) Photoemission images of (Li0.84Fe0.16)OHFe0.98Se measured at a temperature of 20 K along three high-symmetry cuts, Γ cut, M2 cut and M3 cut, respectively. (d) The second-derivative image of c with respect to the energy, to reveal the band structure better. For comparison, e–j show photoemission images of a superconducting single-layer FeSe/SrTiO3 film and (Tl,Rb)xFe2−ySe2 measured along the same Γ cut, M2 cut and M3 cut, respectively. The location of the three momentum cuts are shown in k. The red dashed lines in a–j images are the guide to the eyes for the observed band structures. (l–n) DFT calculation results. (l) The crystal structure for the DFT calculation. (m) The Fermi surface and band structures along high symmetry directions are shown in n. In o, the table lists the bottom position of the electron band near M, the superconducting gap size and corresponding Tc for these three systems. The gap size for FeSe11111 will be obtained in Fig. 3e.

