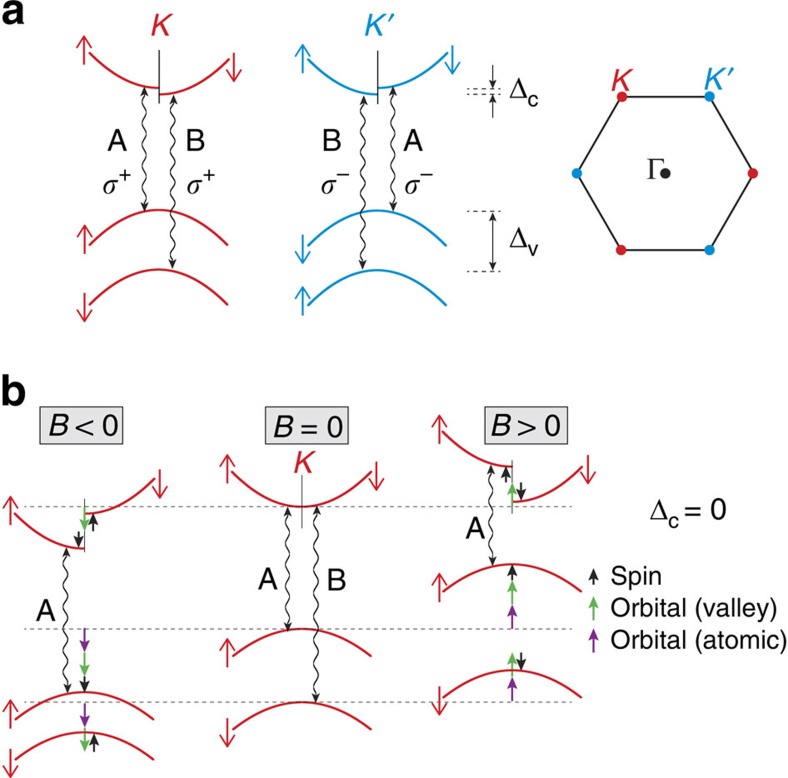
Figure 1. Excitonic transitions and Zeeman shifts in monolayer TMDs.
(a) Diagrams of the conduction and valence bands at the K and K′ valleys of the monolayer transition-metal dichalcogenides, showing the A and B exciton transitions (wavy lines) and the associated valley-specific optical selection rules for σ+ and σ− light. For clarity, the spin-up and spin-down conduction bands are separately drawn on the left and right sides within each valley, respectively. A small spin–orbit splitting in the conduction band, Δc, is also depicted for completeness (theory predicts Δc∼+30 and −5 meV for WS2 and MoS2, respectively45). (b) Diagrams depict the relative shifts of the conduction and valence bands in the K valley (that is, σ+ transitions) due to applied magnetic fields  . For clarity, Δc=0 here. The contributions to each band's Zeeman shift from spin, atomic orbital and valley orbital (Berry curvature) magnetic moment are depicted separately by black, purple and green arrows. The σ+ polarized A and B exciton transition energies decrease (increase) in positive (negative) field. By time-reversal symmetry, the shifts depicted here for B<0 in the K valley are equivalent to those in the K′ valley (σ− transitions) when B>0.

