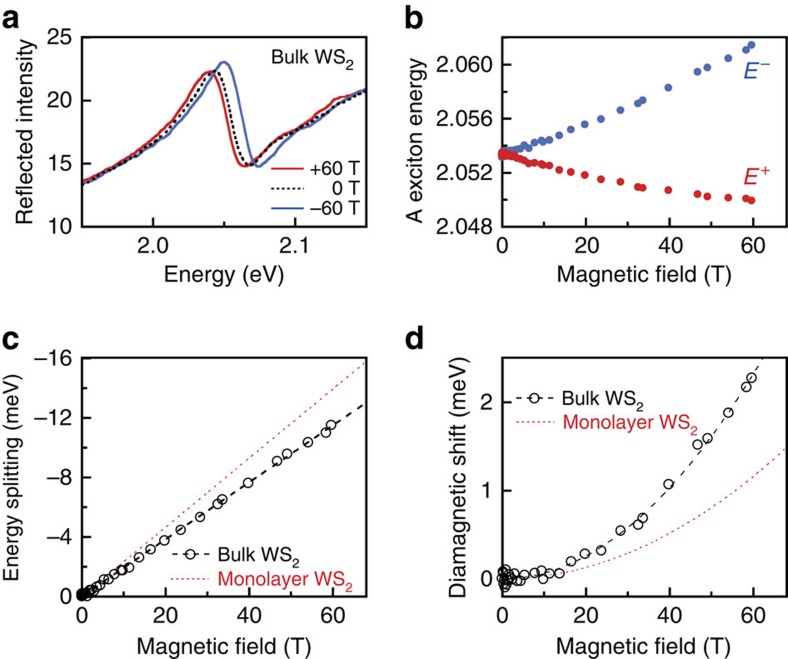
Figure 4. Zeeman splitting and diamagnetic shift in bulk WS2.
(a) Intensity of reflected σ+ light from the A exciton in bulk WS2 at 4 K, using B=0, +60 and −60 T. (b) Energies of the Zeeman-split exciton transitions, E+ and E−. (c) The measured exciton splitting (E+−E−), corresponding to g=−3.33. For comparison, the red line shows the valley Zeeman splitting measured in monolayer WS2 (cf. Fig. 2f). (d) The average energy (E++E−)/2 showing a diamagnetic shift (0.64 μeV T−2) that is twice as large as that measured in monolayer WS2 (red line; cf. Fig. 2g).

