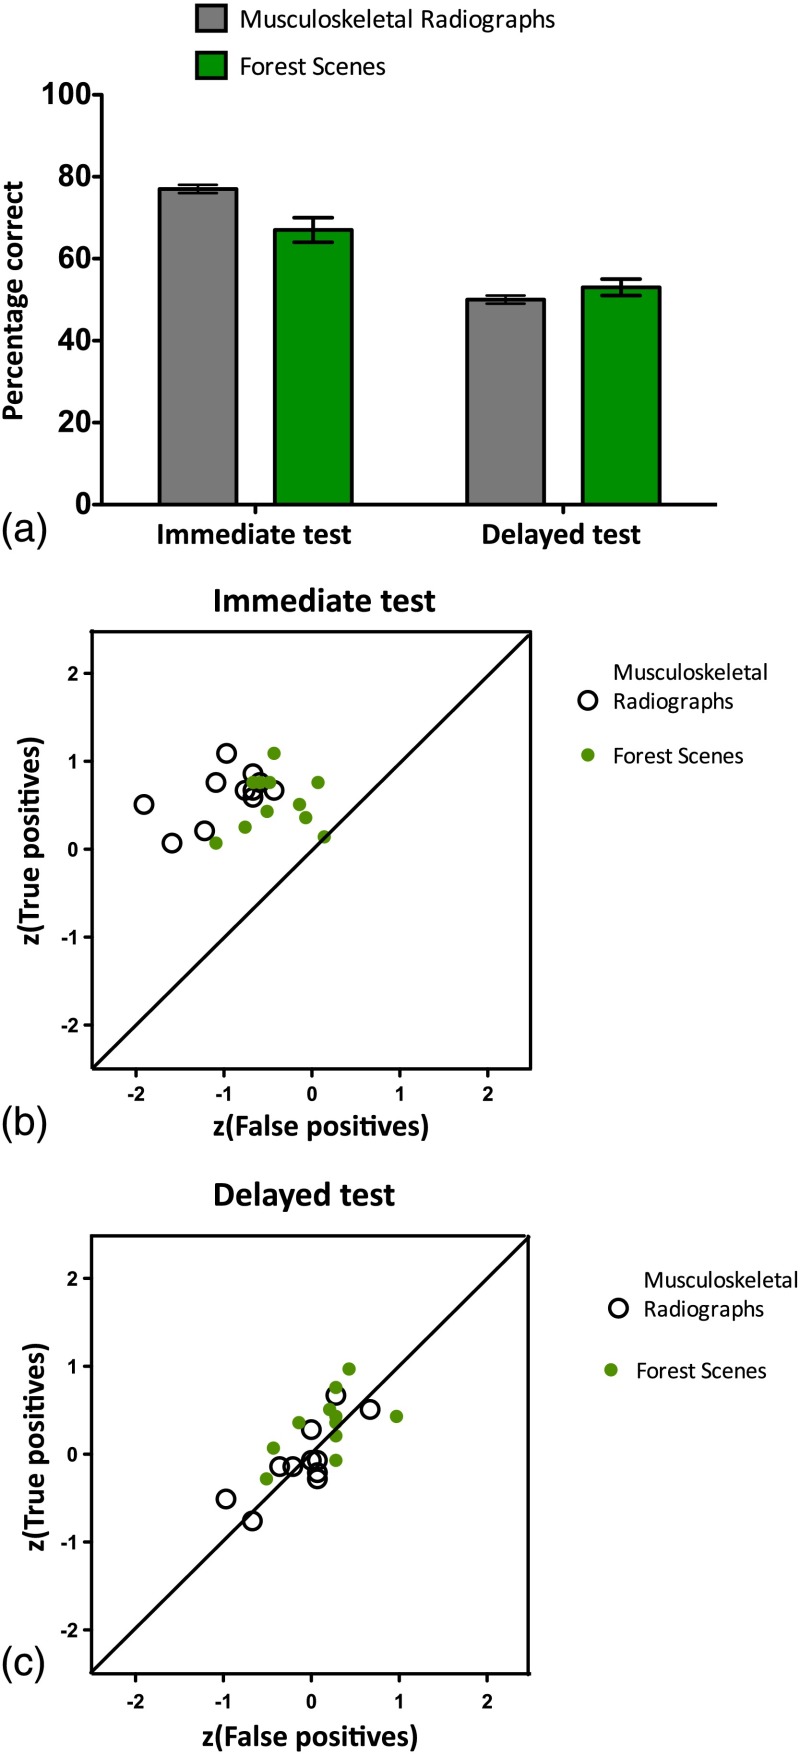
Fig. 3.
Performance on visual recognition memory test of the radiologists on two images sets (forests and musculoskeletal radiographs) during the immediate and delayed recognition test. (a) Average accuracy for the two image sets across two different recognition times. Error bars represent standard error of mean. (b) Scatter plot of score true positives against score false positives by image set on immediate recognition test (average for forest scenes: 70% hits, 35% false positives; average for radiographs: 73% hits, 19% false positives). (c) Scatter plot of score true positives against score false positives by image set on delayed recognition test (average for forest scenes: 63% hits, 57% false positives; average for radiographs: 47% hits, 47% false positives).

