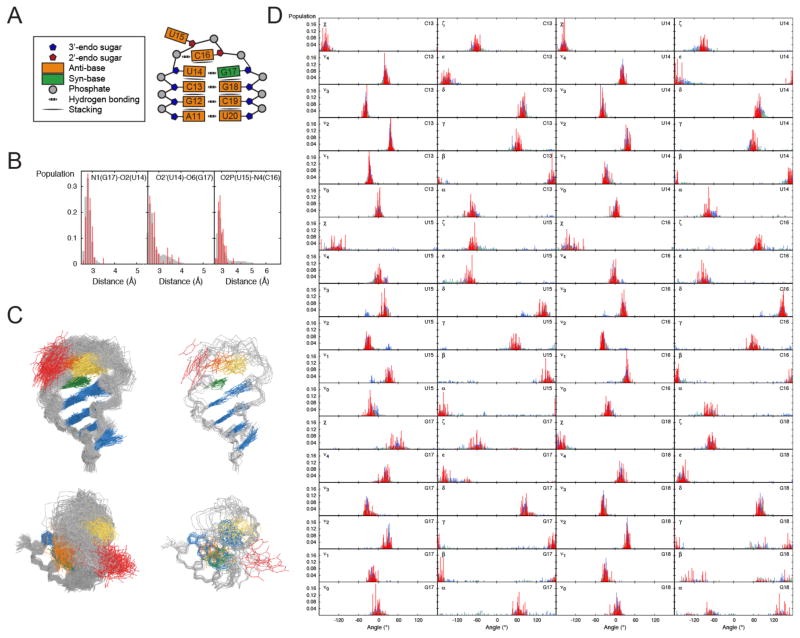
FIGURE 3.
Comparison of the MD and RDC-selected ensembles for the cUUCGg tetraloop. (A) Schematic representation of the interactions and structural features of the cUUCGg loop. (B) Distance distributions between N1(G17)-O2(U14), O2′ (U14)-O6(G17) and O2P(U15)-N4(C16) that describe the H-bonding interaction between U14-G17 and U15-C16 in the MD (grey) and the RDC-selected ensemble (red) (C) Comparison of 100 randomly selected conformers from the MD (left) and RDC-selected ensemble (right), coordinates are included in the Supporting Information. (D) Comparison of dihedral angle distributions in the cUUCGg loop from the MD (grey), RDC-selected ensembles (red) and ensemble representing the cUUCGg structures in the PDB with (blue) and without (green) bound proteins and ligands.

