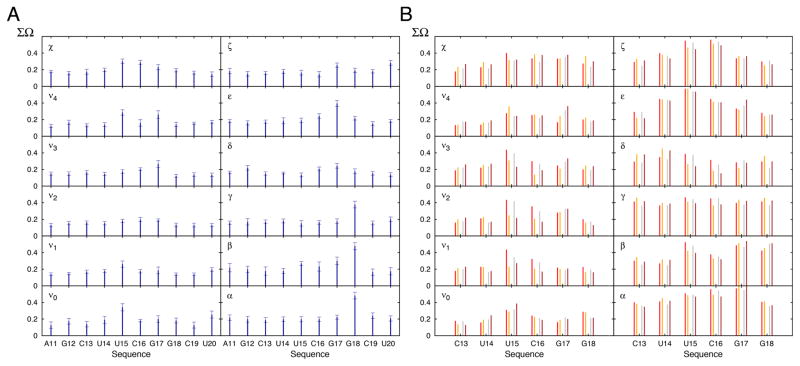
FIGURE 4.
Conformational variability in the MD-derived and RDC-selected ensemble of the cUUCGg hairpin. (A) Shown is the ΣΩ value between the MD and RDC-selected ensemble for all the backbone and sugar dihedral angles. A decrease in ΣΩ indicates an increase in similarity. Error bars are derived from Monte Carlo simulations (Methods). (B) ΣΩ value comparing the structural pool of the cUUCGg loop from the PDB (Methods) and the RDC-selected ensemble (red) or the MD trajectory (grey). Shown in orange and brown is the corresponding comparison when restricting the PDB structures to unbound RNA.

