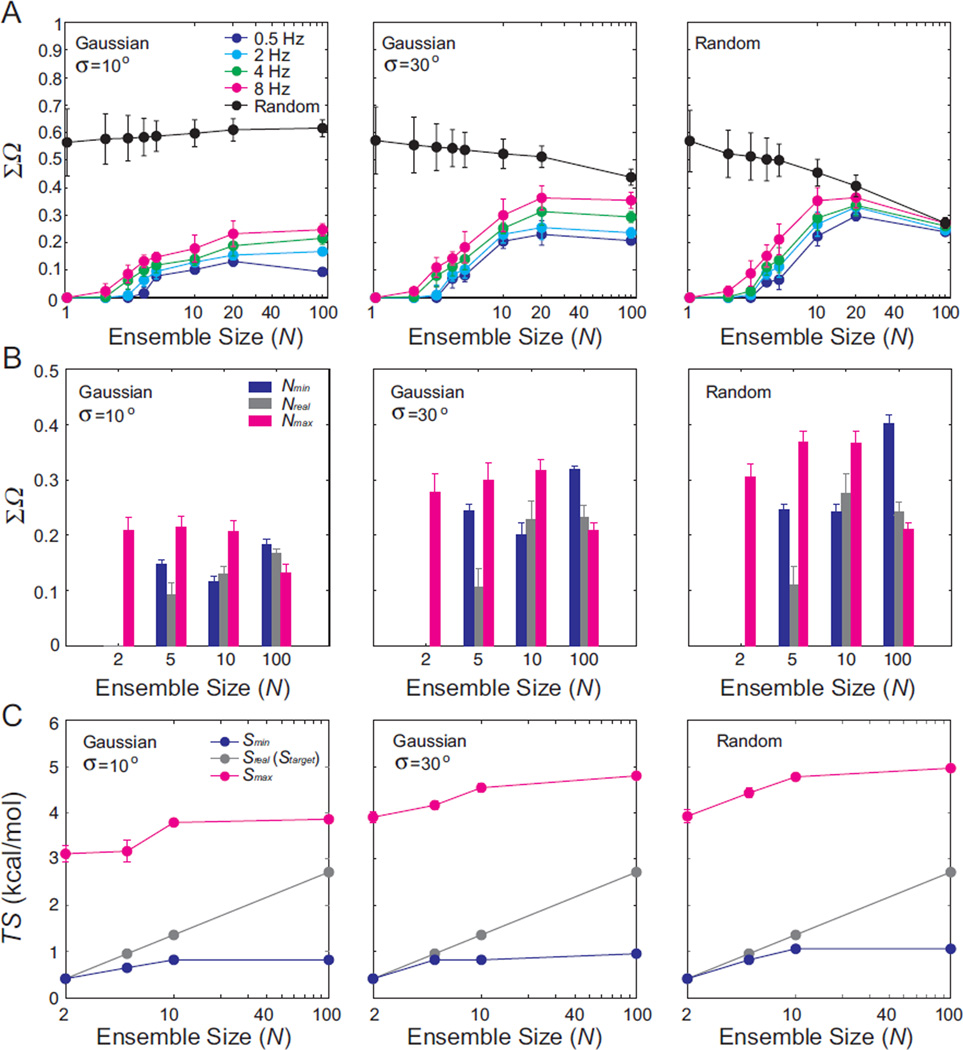
Figure 2. Comparison of RDC-satisfying ensembles with target ensembles.
The similarity between RDC-satisfying ensembles with (A) prefixed and (B) variable ensemble size and target ensembles for three distinct distributions: Gaussian target ensemble with σ =10°, 30° and random target ensembles with RDC uncertainty. The values of ΣΩ represent the average over 100 simulations and the error bar represents the standard deviation. The similarity between the target ensemble and a randomly selected ensemble of equal size is also shown in black. (B) Results are shown for RDC-satisfying ensembles predicted using different ensemble sizes: Nmin (blue), Nreal(gray) and Nmax (magenta) using 2Hz RDC uncertainty. The values of ΣΩ represent the average over 100 simulations and the error bars represent the standard deviation. (C) Comparison of conformational entropy for RDC-satisfying ensembles determined using Nmin (blue), Nreal (gray) and Nmax (magenta) and for the target ensemble. Values represent the average of 100 simulations and error bars indicate the standard deviation.

