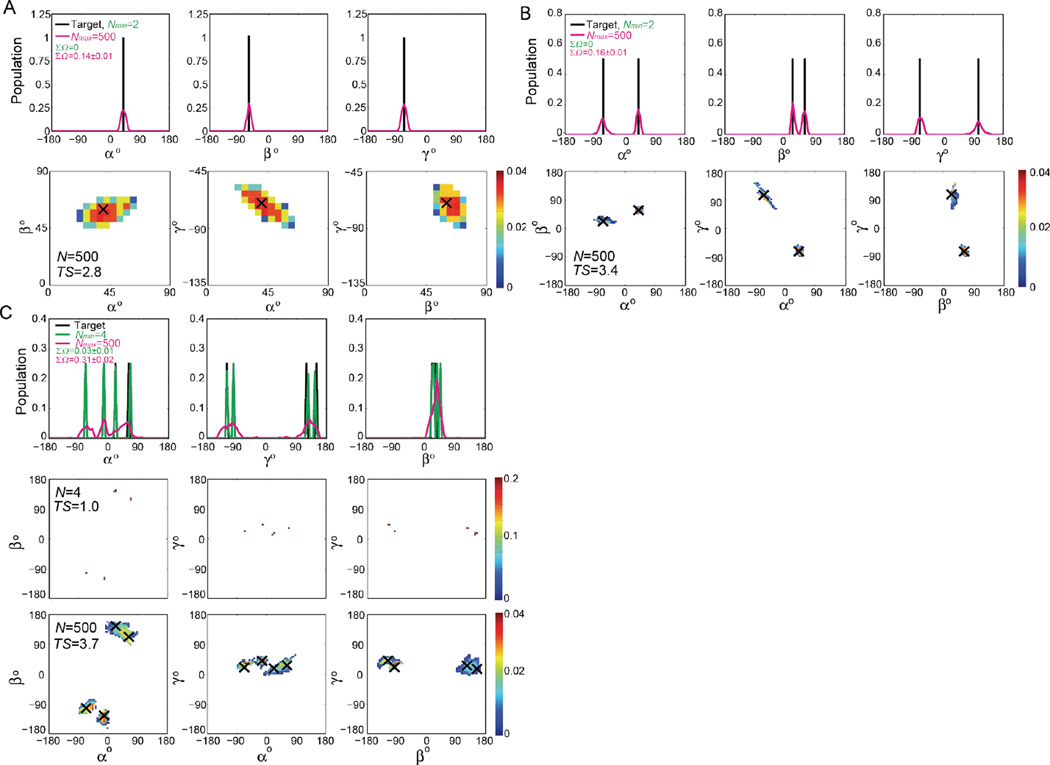
Figure 4. Comparison of RDC-satisfying and target ensembles: Discrete distributions.
1D and 2D population-weighted distributions of inter-helical angles (αh βh γh) for Nmin (green) and Nmax (magenta) RDC-satisfying ensembles and corresponding target ensembles consisting of a discrete distributions with size (A)N=1, (B)N=2, and (C)N=4. The value of ΣΩ comparing the RDC-satisfying and target ensemble is shown in each case. The Nmin RDC-satisfying ensembles perfectly overlap with the target ensembles and therefore only the Nmax RDC-satisfying ensembles are shown in the 2D distributions with target conformations indicated using black crosses. The value of ΣΩ comparing the RDC-satisfying and target ensemble and the TS values (in kcal/mol) are shown in the 2D distributions for each ensemble.

