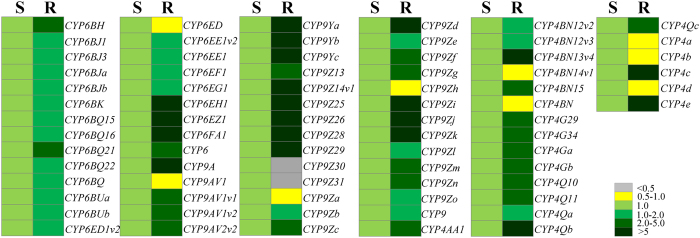
Figure 2. A large number of CPB P450 genes are overexpressed in the R strain.
The relative expression ratios of 76 CPB P450s in imidacloprid Resistant (R) strains compared with those in the Susceptible (S) strain by qRT-PCR are shown. The rectangles are colored on the basis of mean (n = 6) relative mRNA levels in S and R strains. The levels of relative expression are illustrated by a six- category color scale as shown in the legend. The relative expression ratios between R and S strain and p-values are listed in Supplementary Material: Table S4.

