
Figure 5. Venn diagram representing the overlapping of induction and overexpression of CPB P450s.
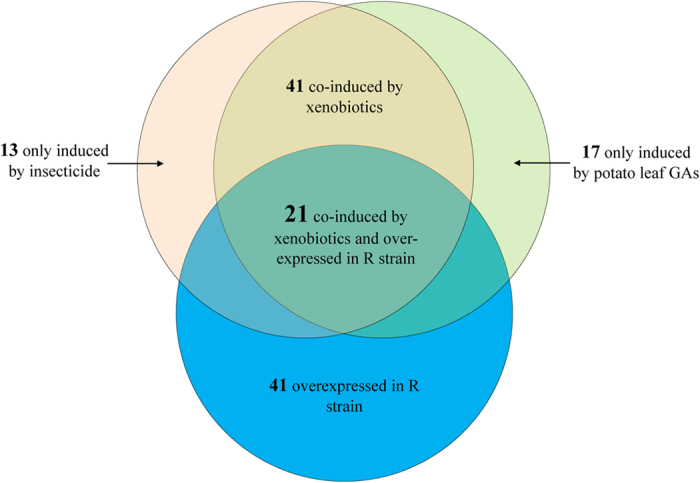
P450s induced by potato leaf GAs in either gut or fat body of female CPB R adults are shown in green circle. P450s induced by imidacloprid are shown in pink circle (induction ratio > 2-fold; p < 0.05; details are listed in Table S5). The blue circle exhibits P450s that are overexpressed in the R strain than the S strain by > 2-fold and a p value < 0.05 (Table S4).