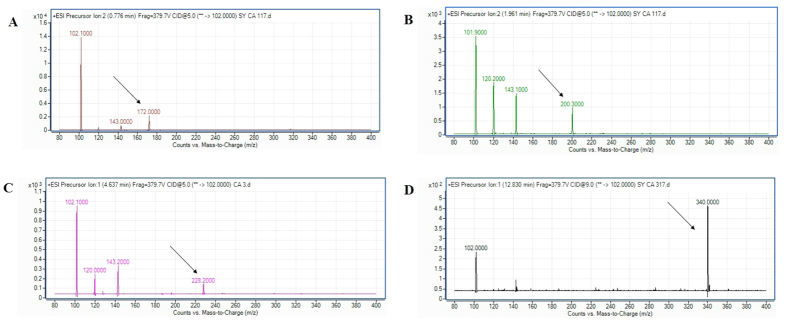
Figure 3. Mass spectrometry analysis of spent supernatants extract C. amalonaticus strain L8A.
(A) Mass spectra of C4-HSL (m/z 172.0000) (marked by arrow). (B) Mass spectra of C6-HSL (m/z 200.3000) (marked by arrow). (C) Mass spectra of C8-HSL (m/z 228.2000) (marked by arrow). (D) Mass spectra of C16-HSL (m/z 340.0000) (marked by arrow).

