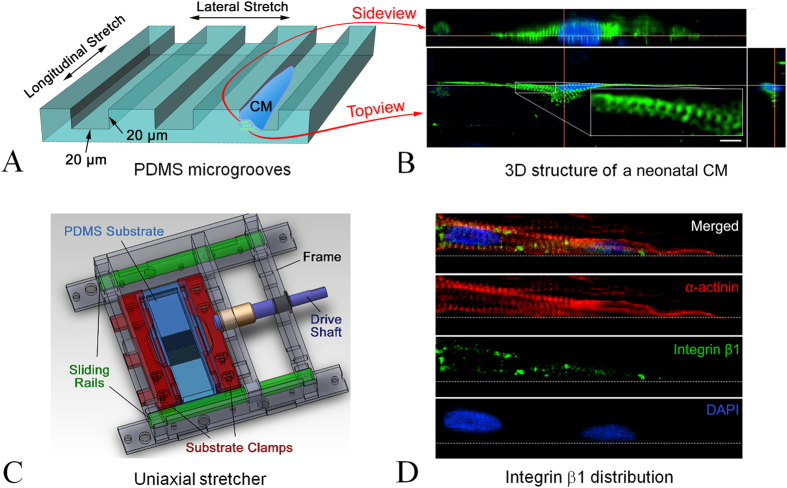
Figure 1. 3D stretch culture model.
(A) Dimensions of PDMS microgrooves; arrows indicate the direction of uniaxial loads. (B) 3D confocal image of a neonatal CM inside the microgroove: green, α-actinin; blue, cell nucleus; the insert shows a zoomed-in image of the aligned sarcomeric structure; scale bar: 10 μm. (C) Structure of the uniaxial cell stretcher. (D) Confocal image of integrin distribution on a neonatal CM inside a microgroove (a 2D image showing the distribution on the bottom surface, side wall distribution not shown).

