
Figure 2. A typical curve indicating sarcomere-length restoration (n = 6).
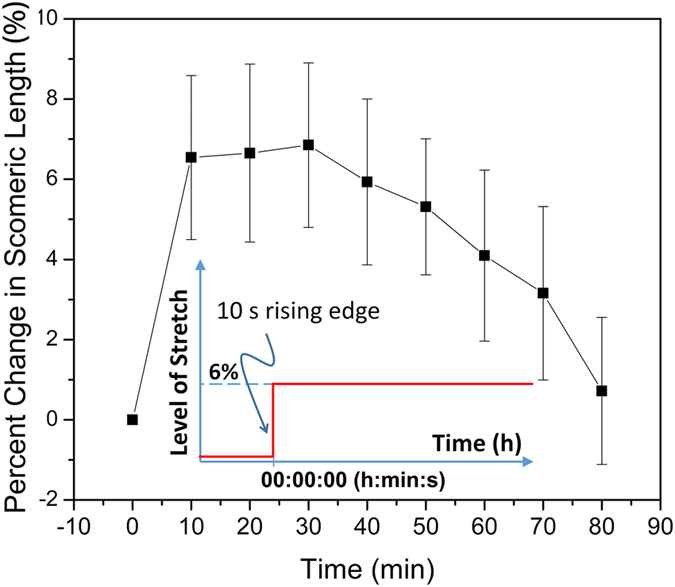
The insertion is a time-course curve of the stretch. It is a step function of time, with a very sharp rising edge ( <10 s) and a constant (static) stretching level (6%) that lasts (is sustained) during our imaging period, which was typically 4 h (acute effect).