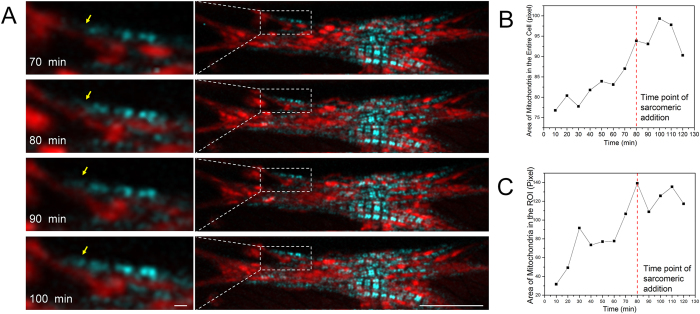
Figure 6. Mitochondrial clustering during sarcomeric addition measured during stretch.
(A) Merged images of sarcomeric A-bands from the SHG channel in cyan and mitochondria from the 2 P channel in red during 70–100 min; arrows point to a newly added sarcomere; left column is a zoomed region of interest in the right column, and scale bars are 1 and 15 μm. (B) Change of mitochondrial area of the entire cell. (C) Change of mitochondrial area in ROI presented in (A). In both (B,C), the area was estimated through image binarization; thus the unit is number of pixels with a value of “1,” and the dashed red lines indicate the time-point of addition of a new sarcomere (80 min) during 10–120 min.

