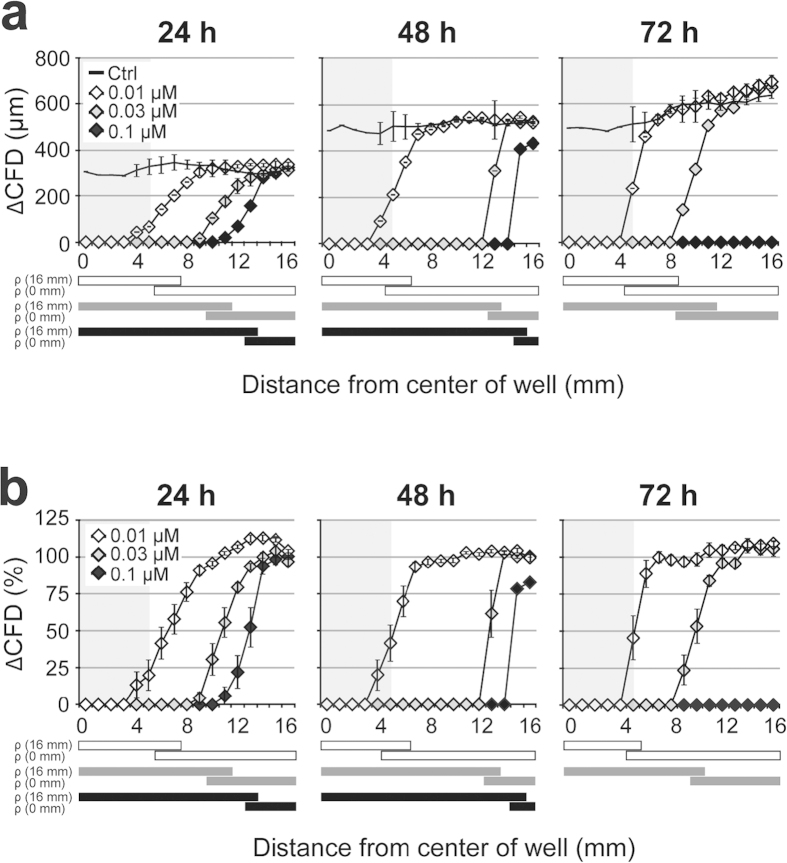
Figure 3. Effects on cell migration indicates cytotoxicity in a dose and time dependent manner.
(a) Pellets with three different concentrations of CdSO4 were placed on top of the agar overlay. After 24, 48, and 72 h, pictures were taken at each mm along the scratch, on both sides and two migration distances were measured per picture. In addition, viability was assessed for each time point with Neutral Red. (b) Same as for (a) but here the migration distances are normalized to the respective control values. Experiments were run in triplicates and data represents mean ± S.E.M. over the mean experimental data. Significant effects (P < 0.05) are indicated with the bars below the graph. P < 0.05 compared with the migration distance at 16 mm (ρ (16 mm)) or at 0 mm (ρ (0 mm)). Significant effects for 0.01, 0.03, and 0.1 μM CdSO4 are indicated with white, grey and black bars, respectively.

