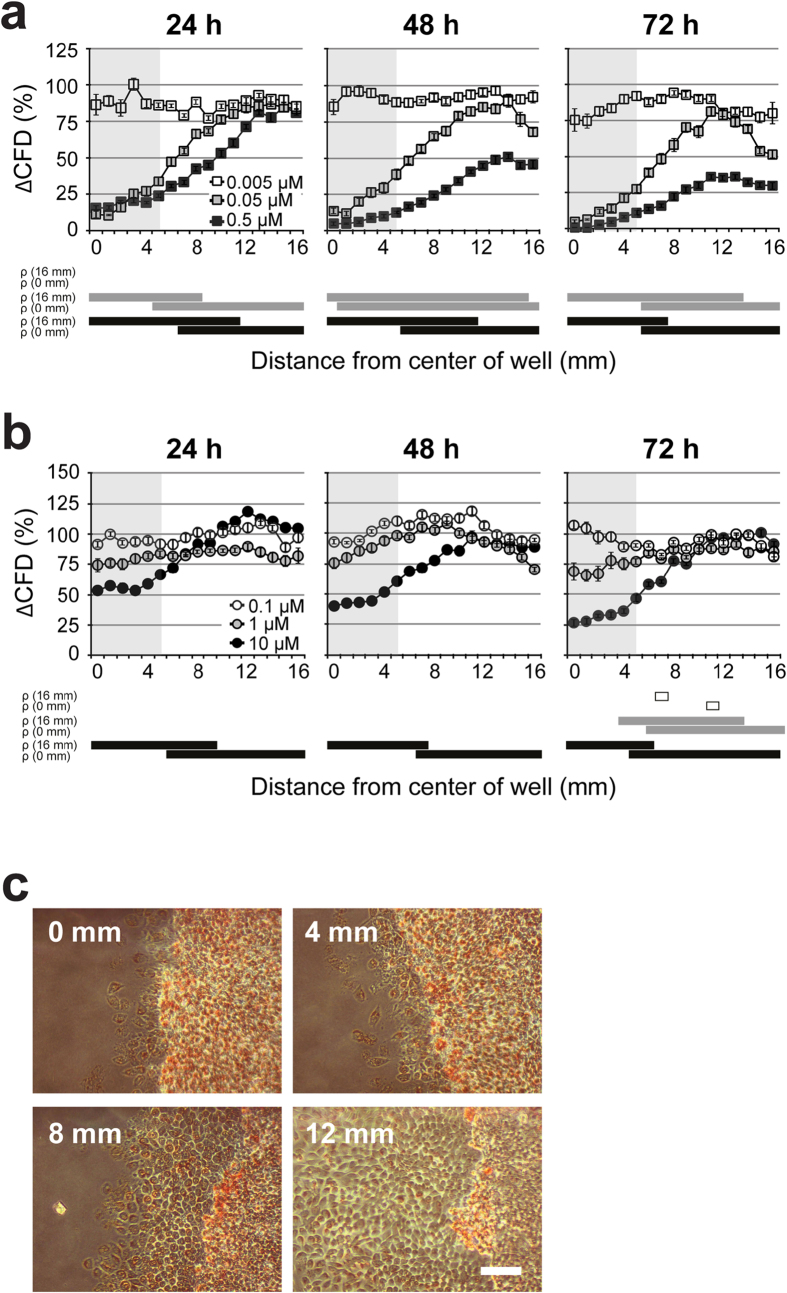
Figure 5. Cell migration indicates negative effects of bioactive compounds.
Different concentrations of salinomycin (a) and cytochalasin D (b) were tested by the pellet method. For each time point, cell viability was assessed with NR staining. Migration distances were normalized to the corresponding control values. n = 3, data represents mean ± S.E.M. over the mean experimental data are indicated with error bars. The grey area in (a,b) indicates the locations covered by the agar pellet. The bars below the graph indicate P < 0.05 compared with the migration distance at 16 mm (ρ (16 mm)) or at 0 mm (ρ (0 mm)). Significant effects for 0.005, 0.05 and 0.5 μM salinomycin and 0.1, 1 and 10 μM cytochalasin D are indicated with white, grey and black bars, respectively. (c) Pictures were taken of cells, treated with 0.05 μM salinomycin for 72 h at the indicated distance from the center of the well. Scale bar is 100 μm.

