Figure 2.
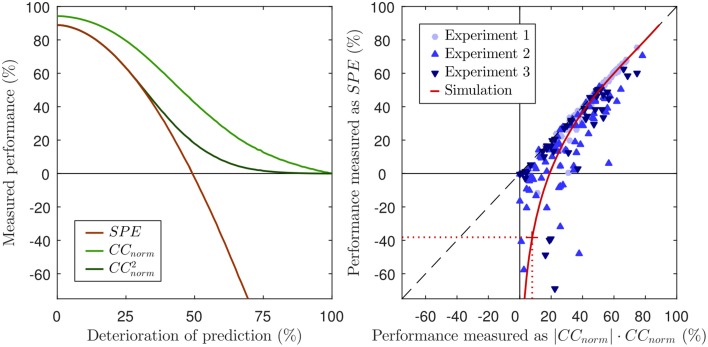
Left panel: Same figure as the left panel of Figure 1, but including CCnorm and its squared values for reference. Note that, for good predictions (values above ca 50%), and SPE are almost identical, both yielding very similar estimates of the proportion of “explainable variance explained.” This is as might be expected given the equality of Equation 7 and 28 when ŷ → y. However, as the prediction performance declines below 50%, and SPE increasingly and sharply diverge. Right panel: Scatter plot of performance scores for predictions of neuronal responses from three different experiments. Each marker reflects the performance score of the prediction of the response of a single neuron. The black dashed line visualizes where SPE equals . The values of CCnorm have been multiplied with their absolute value to demonstrate that negative values only occur for SPE, but not for CCnorm. The solid red line shows the values for the simulation of Figure 1, the dotted red line and the red cross mark the performance scores of the 60% noise simulation of the lower right panel in Figure 1. Corresponding to the overlap of SPE and CCnorm for good predictions, the red line approaches the dashed black line.

