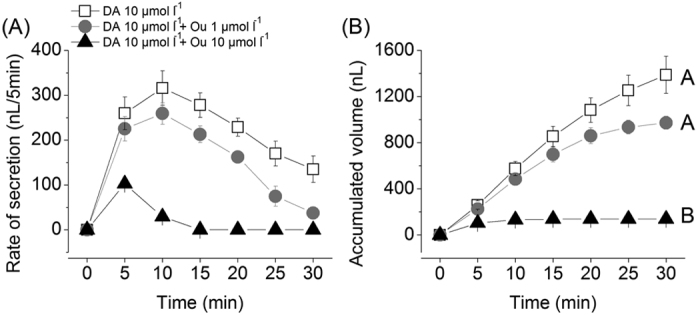
Figure 3. Secretory activities of isolated salivary glands induced by dopamine and ouabain treatments.

(A) The salivary secretion pattern observed over a 30-minute time period following treatments (B) Accumulated saliva volume over a 30-minute time period after treatments. The symbols indicate averages with standard error of the mean (s.e.m.) of three replicates. The data were analyzed by an ANOVA-Tukey-Kramer HSD test (p = 0.05). Different letters indicate significant differences.
