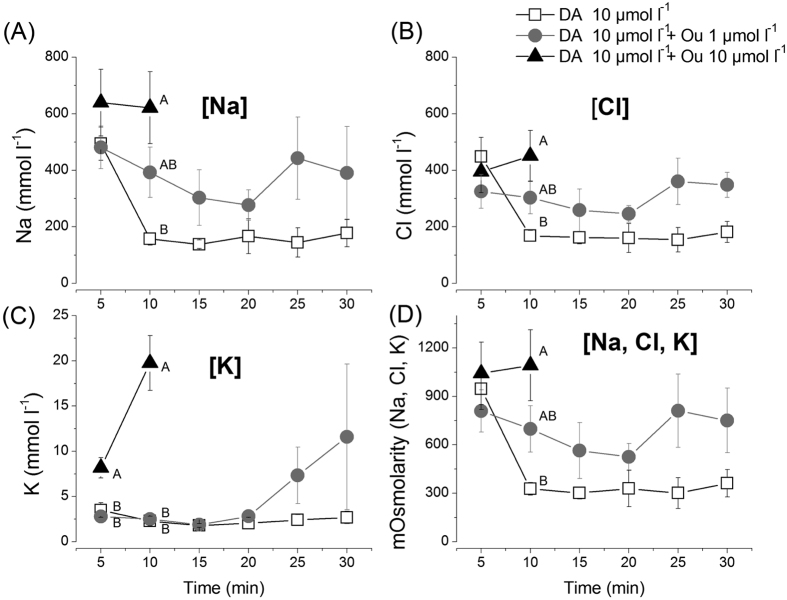
Figure 6. Ion composition and osmotic concentration of secreted saliva from isolated salivary glands.
(A–C) The major three ions’ (Na+, Cl−, K+) secretion patterns over a 30-minute time period following treatments. (D) The pattern of total osmotic concentration of three major ions (Na+, Cl−, and K+) in the saliva secreted over a 30 minute time period. SEM/EDS was used to analyze each ion concentration from each time point. Standard curves for each ion (Na+, Cl−, and K+) were generated with NaCl and KCl (see Supplementary Fig. S4). The symbols indicate averages with standard error of the mean (s.e.m.) of three replicates. The data were analyzed by an ANOVA-Tukey-Kramer HSD test (p = 0.05). Different letters indicate significant differences.

