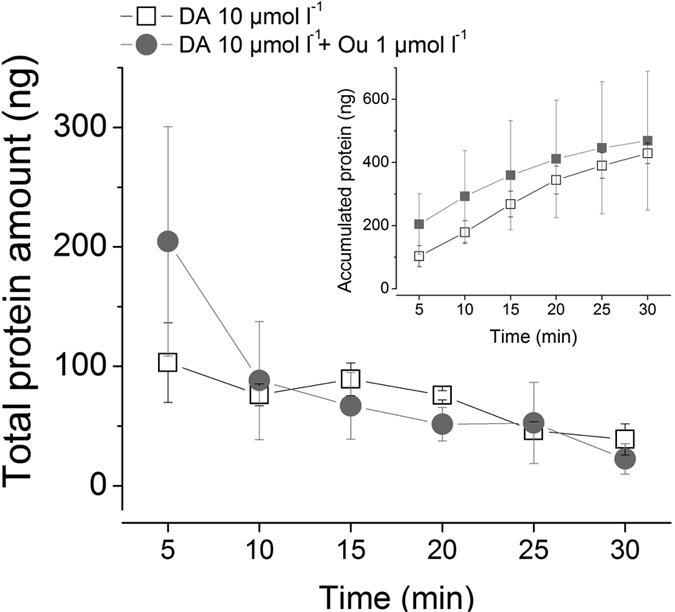
Figure 7. Protein quantification of secreted saliva.

Protein secretion over a 30-minute time period following treatments: dopamine (10 μmol l−1) alone (empty box) and dopamine (10 μmol l−1) with ouabain (1 μmol l−1) (grey circle). Inset graph, accumulated protein amounts over 30 minutes after treatments. The data are the averages with standard error of mean (s.e.m.) for at least three biological replicates. Values were plotted after conversion by applying value ratio between CBQCA analysis and TapeStation analysis.
