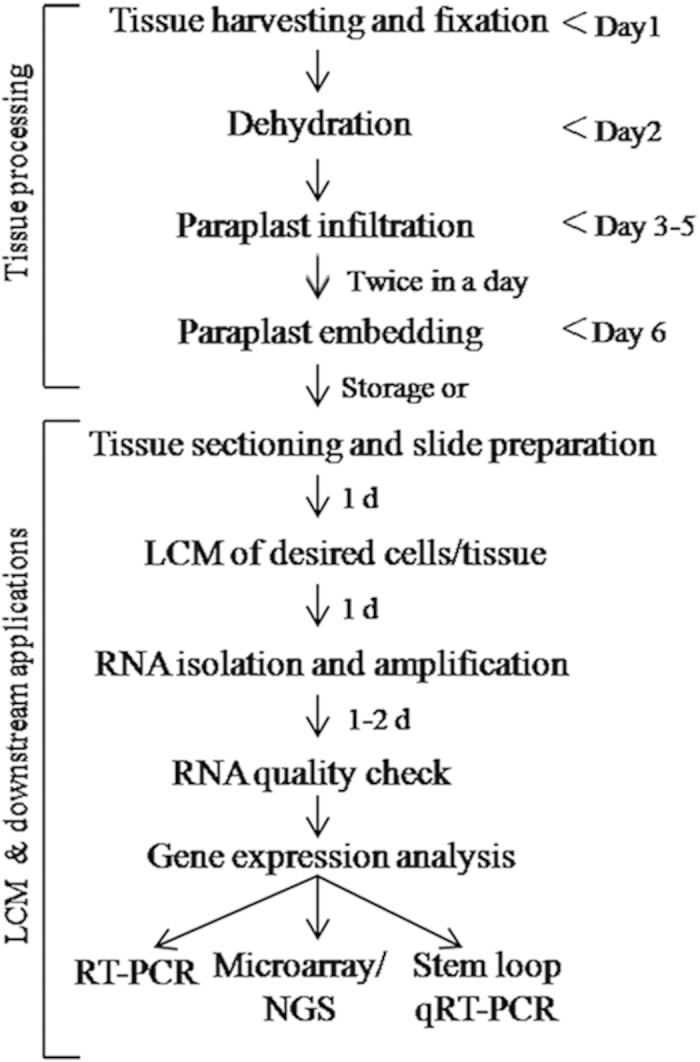
Figure 1. Schematic flowchart of the LCM based tissue specific RNA isolation and gene expression study.

Flowchart is divided into two parts: tissue processing, LCM and its downstream applications. Flowchart indicates the predicted timing involved at each step of the experiment. ‘d’ indicates day.
