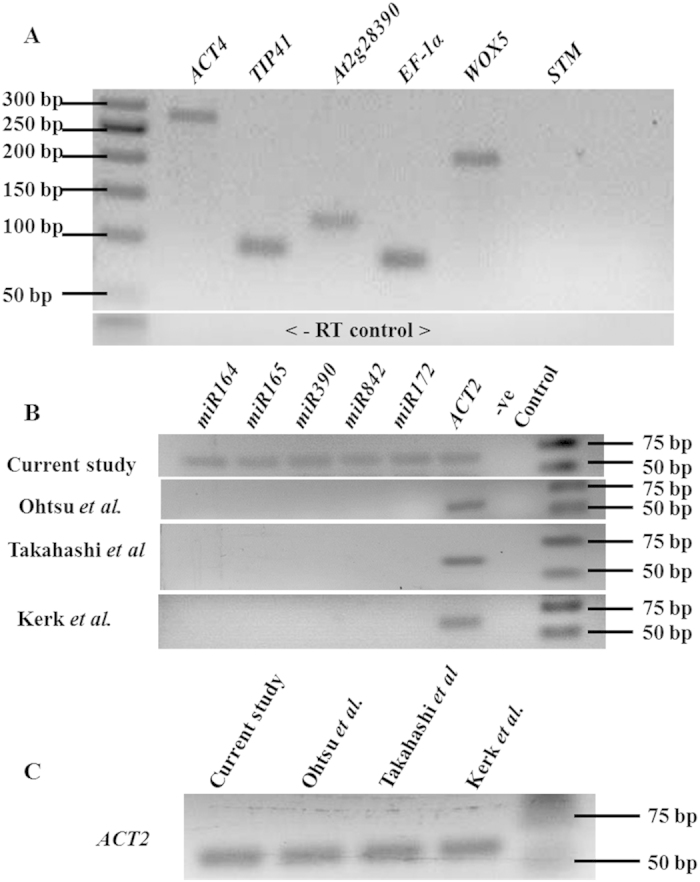
Figure 3. Expression analysis of selected genes and miRNAs using RT-PCR and stem loop RT-PCR, respectively.

(A) RT-PCR showing the expression of constitutive ACT4, TIP41, At2g28390, EF-1α, and root specific WOX5 genes; no expression of SAM specific STM was observed in RAM derived RNA indicating no tissue contamination. Lower panels: minus RT control. (B) Stem-loop RT-PCR, showing the expression of mature miR164, miR165, miR390, miR842, miR172, and ACT2. (C) ACT2 normalization for semiquantitative RT-PCR.
