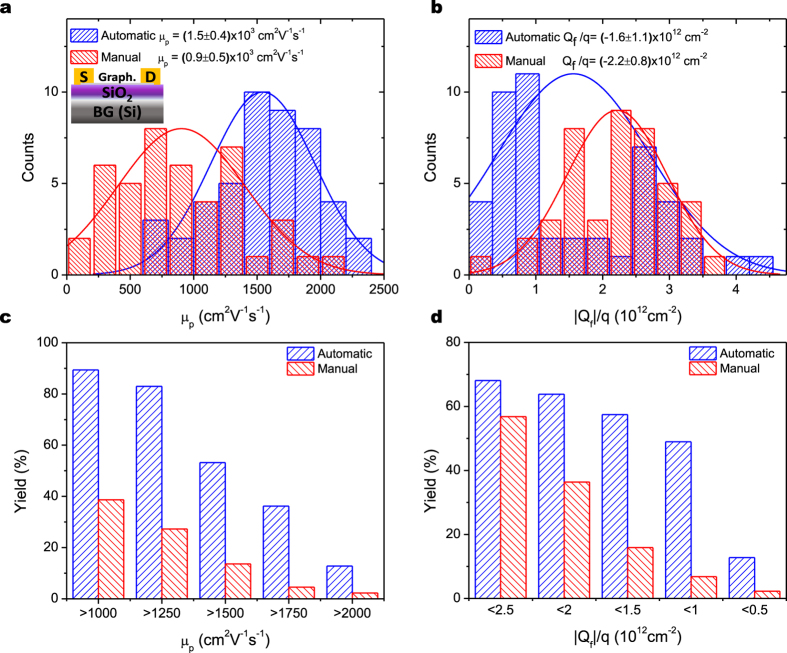
Figure 3.
Histograms of the (a) mobility μ and (b) doping concentration  extracted from the GFET devices fabricated using automatically and manually transferred graphene. The inset in (a) shows the schematic of the GFET. The values of the magnitudes indicated correspond to the mean and standard deviation values of the histograms fitted to a normal distribution (lines). Yield of GFETs with (c) mobility and (d) doping values above a given threshold. Higher mean mobility and lower mean doping values, as well as much better yields, are observed for the devices fabricated on automatically transferred graphene.

