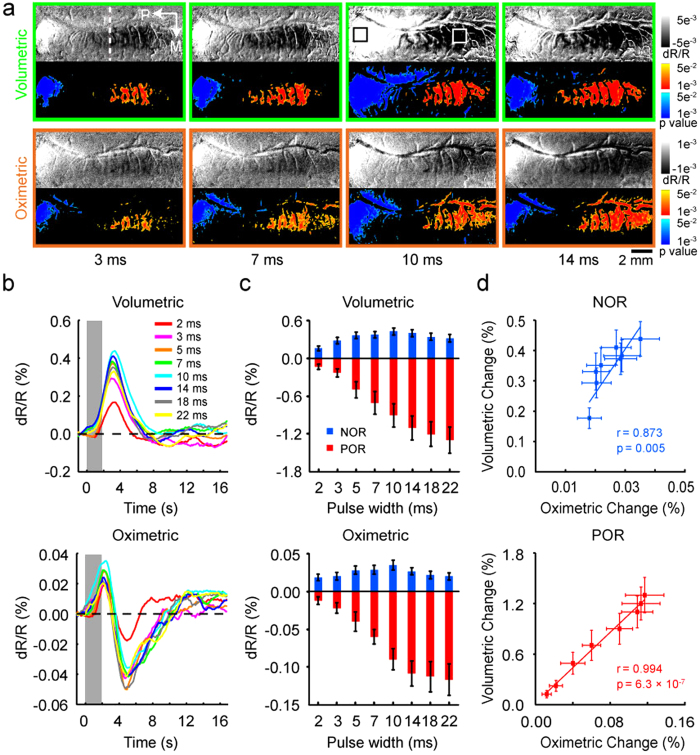
Figure 3. Dependence of cortical OIS responses on stimulus pulse width.
(a) Optical single-condition maps averaged over 1.75–2.25 s after stimulus onset and corresponding P-value maps (two-tailed t test, P < 0.05, n = 148 trials) of cortical activation evoked by various stimulus pulse widths. Top: 530-nm images; Bottom: 610-nm images. Color bars for single-condition maps represent reflectance change (dR/R). Color bars for P-value maps indicate P-values for decreases (warm colors, POR) and increases (cold colors, NOR) in light reflectance. (b) Averaged time courses of volumetric and oximetric signal changes evoked by stimuli of different pulse widths in the NOR region. (c) Peak values of the POR and NOR signal changes as a function of stimulus pulse widths. Data were averaged over all of the pixels within selected ROIs across 6 cats. (d) Oximetric and volumetric signals (the absolute value of magnitude) were significantly related to each other in both POR and NOR regions. Error bars indicate SEM.

