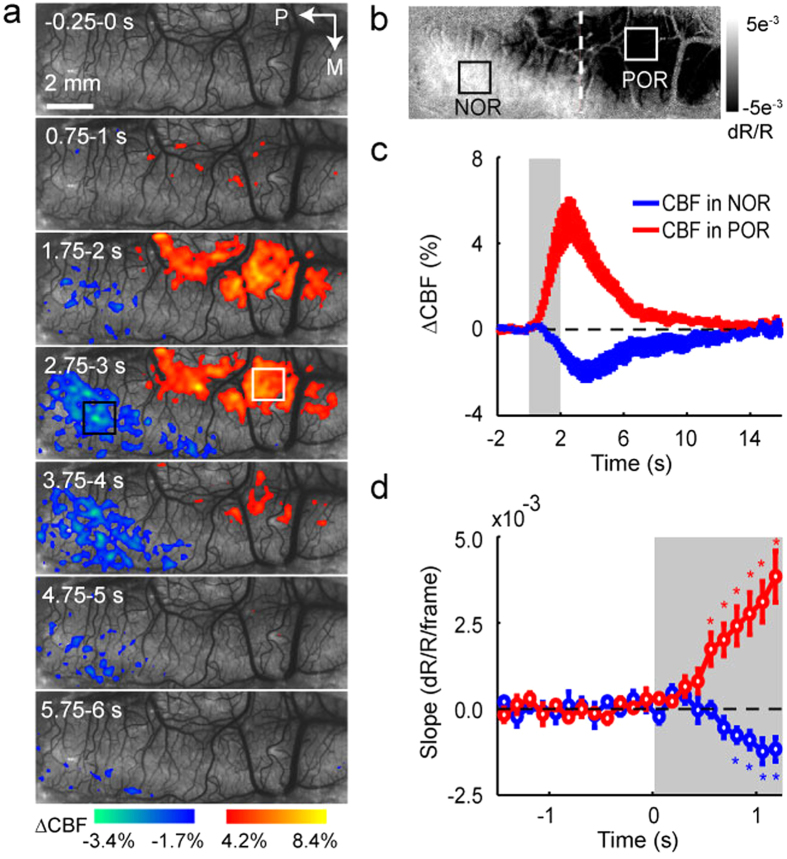
Figure 4. Relative changes in CBF responding to TcES (20 Hz, 1.2 mA, 10 ms).
(a) High spatiotemporal resolution imaging of CBF averaged over 96 trials from one cat. Stimulus started at 0 s and lasted for 2 s. White and black boxes indicate two ROIs determined by OIS imaging (shown in (b)) located at the POR and NOR regions for subsequent analysis. Color bars represent relative changes in CBF. (b) Map of volumetric signal averaged from 1.75–2.25 s by OIS imaging from the same cat. (c) The graph illustrates the percent changes in CBF in the POR and NOR regions. (d) The slopes of reflectance changes for CBF. *indicates slopes significantly different from baseline before stimulus onset (Wilcoxon test, P < 0.05, n = 5). The data in (c,d) were averaged over 5 cats. Error bars show SEM.

